Mean Time To Repair: Formula, Benchmarks, and How to Reduce It

Mean Time To Repair: Formula, Benchmarks, and How to Reduce It
Mean time to repair (MTTR) is the average time required to restore a failed system or asset to operational condition. The formula is straightforward: MTTR = total corrective repair time ÷ number of repairs. Before you run that calculation, though, you need to settle one question: does “repair time” mean active technician labor only, or does it include detection, waiting for parts, and verification? That choice changes your number significantly, and it changes what your SLA actually guarantees.
Two things you can do right now:
- Pin your start and stop timestamps. Repair-only MTTR (per MIL-HDBK-338B) starts when a technician begins active work and ends when the asset is restored. Recovery MTTR starts at failure detection and ends when the system is verified operational.
- Run a quick check on your last 30 failures. Sum the repair durations and divide by 30. If you get a number that surprises you, the culprit is usually a handful of long-tail events pulling the mean up.
Key Takeaways
Accurate MTTR measurement requires a documented definition, consistent timestamps, and a focus on long-tail events rather than median repair time alone.
| Point | Details |
|---|---|
| Define before you measure | Document whether you use repair-only or recovery MTTR before comparing numbers across teams or vendors. |
| Capture five timestamps | Log failure detected, dispatched, repair started, repair completed, and verified for every event. |
| Report mean and median | Mean drives availability math; median reflects typical technician experience — you need both. |
| Target the tail first | Long-tail events (parts waits, escalation failures) move the mean more than optimizing typical repairs. |
| Firmanager automates the timestamp chain | Work orders, dispatch, parts management, and real-time MTTR analytics in one platform. |
Table of Contents
- What mean time to repair actually measures
- How to calculate MTTR precisely
- Common measurement pitfalls and what to exclude
- Why MTTR matters to availability, cost, and SLAs
- How to reduce MTTR: a practical playbook
- How to track MTTR: data sources and dashboard setup
- How to set MTTR targets and write SLA language
- Methodology note: why your definition choice changes everything
- What we see in MTTR programs that actually work
- Firmanager helps you track and reduce MTTR from one platform
- Sources
What mean time to repair actually measures
MTTR is a maintainability metric, not a reliability metric. It tells you how fast your team can fix things, not how often things break. That distinction matters when you are choosing which number to track and which to put in a contract.
The confusion usually comes from four terms that share the same acronym or sound nearly identical:
MTTF applies to non-repairable items; MTBF applies to repairable assets. Using MTBF for a component you replace rather than repair leads to a reliability program built on the wrong model. Similarly, Wikipedia’s maintainability entry notes that the strict engineering definition of MTTR excludes Administrative or Logistic Downtime (ALDT), while the incident-management world routinely folds it in. Mixing the two in the same report produces availability math that is simply wrong.
Why the distinction matters for availability: System availability is calculated as MTBF ÷ (MTBF + MTTR). If your MTTR figure includes parts lead time but your MTBF figure does not account for the same downtime window, the availability percentage you report is not comparable to any industry benchmark that uses the strict definitions.
Three practical rules for choosing the right variant:
- Use repair-only MTTR when you are benchmarking technician skill, designing training programs, or specifying maintainability requirements in procurement.
- Use recovery MTTR when you are writing SLA obligations, reporting customer-facing uptime, or calculating the true cost of downtime.
- Track MTTA separately when on-call response speed is a distinct operational lever you want to manage.
How to calculate MTTR precisely
The arithmetic is simple. The discipline is in the timestamps.
Defining your clock start and stop
For repair-only MTTR, the clock starts when a technician begins active hands-on work and stops when the asset is restored to its pre-failure condition. Parts wait time, travel time, and post-repair verification sit outside this window.
For recovery MTTR, the clock starts at the moment of failure detection (first alert, first ticket, or first sensor trigger) and stops when the system is confirmed operational by a verification step. This is the definition Atlassian uses for incident management, and it is the one most SLAs implicitly reference even when they do not say so explicitly.
The formula and why median matters
MTTR = Σ (individual repair durations) ÷ number of repair events
The mean is what you report for availability calculations. The median is what tells you what a typical technician experiences on a typical day. Because repair-time distributions are right-skewed (a few catastrophic events pull the mean up), reporting both mean and median gives a fuller picture than either number alone.
Worked example
Your team logs 8 repair events over a month:
- 0.5 h
- 1.2 h
- 0.8 h
- 2.1 h
- 0.6 h
- 1.0 h
- 9.4 h (parts delay caused a long-tail event)
- 1.4 h
Sum = 17.0 h. MTTR (mean) = 17.0 ÷ 8 = 2.13 h.
Sorted for median: 0.5, 0.6, 0.8, 1.0, 1.2, 1.4, 2.1, 9.4. Median = (1.0 + 1.2) ÷ 2 = 1.1 h.
The mean is nearly double the median because of one long-tail event. That single repair at 9.4 hours is where your improvement effort belongs, not in shaving 10 minutes off the typical 1.1-hour job. You can use the Fivenines MTTR calculator to validate your own arithmetic and test different clock-start rules against the same dataset.
Common measurement pitfalls and what to exclude
Getting the formula right is the easy part. Getting the inputs right is where most teams go wrong.
What accidentally shrinks reported MTTR:
- Excluding events where the technician was unavailable and the asset sat idle (these are real downtime hours)
- Starting the clock at repair-start rather than detection when your SLA actually counts from detection
- Dropping events that exceeded a threshold (“outlier removal”) without documenting the rule
What accidentally inflates it:
- Including parts procurement lead time in a repair-only MTTR figure that is supposed to reflect technician skill
- Counting verification and warm-up time when the benchmark you are comparing against excludes it
- Logging a single multi-day outage as one repair event when it involved multiple failure modes
The long-tail problem deserves specific attention. Atlassian’s incident metrics guidance makes the point directly: MTTR alone does not show detection or response delays, which means a low MTTR can coexist with a terrible customer experience if detection is slow.
Administrative or Logistic Downtime (ALDT) is the most common source of definition mismatch. Wikipedia’s maintainability article is explicit: the engineering standard excludes ALDT from MTTR, but many CMMS systems log it inside the same work order, so your reported number may include it without anyone realizing.
Pro Tip: Tag each work order with at least five timestamps: failure detected, technician dispatched, repair started, repair completed, and system verified. Store all five even if your current report only uses two. This lets you compute both repair-only and recovery MTTR from the same dataset without re-instrumentation, and it gives you MTTA as a free byproduct.
Why MTTR matters to availability, cost, and SLAs
The availability identity makes the stakes concrete:
Availability = MTBF ÷ (MTBF + MTTR)
That one percentage point, achieved without touching failure frequency at all, can represent millions of dollars in production throughput for a high-volume line.
The leverage is asymmetric. Reducing a 2-hour MTTR to 1 hour gains you 0.5 percentage points of availability. Eliminating one 24-hour long-tail event per month from a dataset of 20 repairs can shift the mean by more than an hour. TeepTrak’s practitioner guide makes this explicit: targeting the tail (spares strategy, faster escalation, pre-positioned kits) delivers greater availability gains than optimizing the median repair.
| Context | Typical MTTR range | Notes |
|---|---|---|
| IT/software incident management | 1–4 hours | Varies by severity tier; P1 targets often under 1 hour |
| Discrete manufacturing (world-class) | 2–4 hours | Active repair time; excludes ALDT |
| Field service (HVAC, electrical) | 4–8 hours | Includes travel; recovery definition common |
| Critical infrastructure | Under 2 hours | Often contractually mandated |
These ranges are context-dependent. A 6-hour MTTR for a non-critical pump is acceptable; the same number for a production bottleneck machine is a serious problem. Set targets relative to the asset’s criticality and its position in your process, not against a generic industry average.
How to reduce MTTR: a practical playbook
Cutting repair time is not one intervention. It is a system of four levers pulled in the right order.
1. Fix your alert routing first
If technicians learn about failures from a colleague walking by rather than from an automated alert, you are losing detection time before the clock even starts. Route equipment alarms directly to the responsible technician’s mobile device with a priority tier attached. A P1 alert for a production-critical asset should wake someone up; a P3 alert for a non-critical utility can wait for the morning queue.
2. Build and enforce runbooks
A runbook is a documented, step-by-step repair procedure for a known failure mode. Teams with runbooks for their top 20 failure modes consistently outperform those without them, because the technician does not spend the first 30 minutes diagnosing something that has been diagnosed and solved before. Pair each runbook with a parts list so the technician arrives with the right components.
3. Redesign your spare-parts policy around failure modes, not gut feel
The single biggest driver of long-tail MTTR events is waiting for parts. Analyze your last 12 months of work orders and identify which failure modes caused the longest repairs. For each one, ask: is the required part stocked locally, available from a nearby supplier within 4 hours, or on a 5-day lead time? Pre-position critical spares for your top 10 failure modes. Consignment stock agreements with key vendors can cover the long tail without tying up capital in slow-moving inventory.

4. Close the learning loop after every long-tail event
Any repair that takes more than 3× your median MTTR deserves a brief post-incident review. Not a blame session, but a structured 15-minute debrief: what caused the delay, what would have shortened it, and what process or inventory change prevents recurrence. This is where the biggest MTTR gains come from over time.

5. Cross-train for your most common failure modes
Single-point-of-knowledge is an MTTR risk. If only one technician knows how to repair your most common failure mode and they are on vacation, your MTTR for that event type doubles. Map your top 10 failure modes to the technicians qualified to repair them. Any mode with fewer than two qualified technicians is a training priority.
6. Add a verification step to every work order
Rework is an invisible MTTR inflator. A repair that passes a quick functional check before the technician leaves the site almost never comes back as a repeat failure within 24 hours. A repair that skips verification sometimes does. Build a mandatory verification checklist into your work order closure process.
Pro Tip: Sequence your improvement investments by impact tier. In the first 30 days, instrument your timestamps and identify your top 5 long-tail events from the past 12 months. In the first 90 days, pre-position spares for those 5 failure modes and write runbooks for each. By 180 days, cross-train a second technician for each of the top 10 failure modes and review your alert routing. This sequence consistently delivers the fastest MTTR reduction because it attacks the tail before it optimizes the median.
How to track MTTR: data sources and dashboard setup
Accurate MTTR reporting requires three things: the right data sources, a consistent timestamp set, and a dashboard that shows more than just the mean.
Required data sources:
- Equipment state logs (SCADA, PLC, or IoT sensor data) for failure detection timestamps
- CMMS or work order software for repair-start, repair-end, and technician assignment records
- ITSM incident records for IT/software environments
- Field technician mobile timestamps for travel, on-site arrival, and verification completion
Minimal timestamp set to capture for every event:
- T1: Failure detected (first alert or sensor trigger)
- T2: Technician dispatched or ticket assigned
- T3: Active repair started (technician on-site and working)
- T4: Repair completed (asset restored)
- T5: System verified operational (functional check passed)
With these five timestamps, you can compute repair-only MTTR (T4 minus T3), recovery MTTR (T5 minus T1), and MTTA (T2 minus T1) from the same record.
| Dashboard field | Formula | Purpose |
|---|---|---|
| Mean MTTR (repair) | Σ(T4−T3) ÷ n | Technician performance, training benchmarks |
| Mean MTTR (recovery) | Σ(T5−T1) ÷ n | Availability calculation, SLA reporting |
| Median MTTR | Middle value of sorted repair durations | Typical technician experience |
| 90th percentile MTTR | Value below which 90% of repairs fall | Tail risk, SLA buffer sizing |
| Long-tail count | Events where MTTR > 3× median | Improvement priority queue |
| MTTA | Σ(T2−T1) ÷ n | Escalation and on-call performance |
The 90th percentile field is the one most teams skip and most regret skipping. It tells you the worst repair time a customer is likely to experience in any given month, which is often the number that drives SLA breach risk.
How to set MTTR targets and write SLA language
A target without a definition is not a target. Before you set a number, decide whether you are measuring repair-only or recovery MTTR, and write that choice into every document that references the target.
Choosing mean vs. median vs. percentile for your target:
- Mean is appropriate when availability math drives the target (use in the availability identity formula).
- Median is appropriate when you are setting a technician performance standard (it reflects typical experience, not outliers).
- 90th percentile is appropriate for SLA commitments where you need to bound the worst-case experience for customers.
Sample SLA clause language:
That clause is explicit about start/stop, includes or excludes logistics by name, and assigns responsibility for the spare-parts buffer. Wikipedia’s maintainability article notes that SLA wording often confuses repair guarantees with recovery guarantees, and the ambiguity almost always favors the vendor in a dispute.
| Asset criticality | Recommended target type | Suggested MTTR range | Verification step |
|---|---|---|---|
| Production-critical | 90th percentile recovery MTTR | Under 4 hours | Functional load test |
| High-impact, non-critical | Mean recovery MTTR | 4–8 hours | Operational check |
| Standard/low-impact | Median repair-only MTTR | 8–24 hours | Visual inspection |
Methodology note: why your definition choice changes everything
Before you compare your MTTR to a benchmark, a vendor’s claim, or last quarter’s number, document these choices:
- Which definition are you using? Repair-only (MIL-HDBK-338B active repair time) or recovery (full downtime from detection to verification)?
- What are your T1 and T5 timestamps? Specify the exact system or log that generates each.
- Does your count include all events or only completed repairs? Open or ongoing events at period-end should be excluded or flagged as right-censored.
- What is your rounding rule? Minutes rounded to the nearest 0.1 hour? Logged in seconds and converted?
- What events are excluded? Planned maintenance, customer-caused outages, and force-majeure events should be documented, not silently dropped.
CMMS configuration is a silent MTTR changer. If your system automatically closes a work order when parts are ordered rather than when repair is complete, your repair-end timestamp (T4) is wrong, and every MTTR figure you have ever reported from that system is understated. Audit your CMMS closure rules before you trust historical data.
Pro Tip: When comparing your MTTR to a vendor’s quoted figure or an industry benchmark, ask for the definition document first. If they cannot produce one, treat the number as unverifiable. A vendor claiming a 2-hour MTTR that excludes parts lead time is not comparable to your 4-hour recovery MTTR that includes it. The definitions, not the numbers, are what you are actually comparing.
Use repair-only MTTR when the decision is about technician capability or maintainability design. Use recovery MTTR when the decision is about customer impact, SLA compliance, or true cost of downtime.
What we see in MTTR programs that actually work
Most operations teams that struggle with MTTR are not struggling with the math. They are struggling with instrumentation. The single most common failure mode we see is teams that have been tracking “downtime” for years but cannot tell you whether that number starts at failure detection or at repair-start. When you cannot answer that question, you cannot improve the metric, because you do not know which part of the timeline you are actually managing.
The teams that make the fastest progress follow a consistent sequence. They instrument first, which means getting the five timestamps into every work order before they do anything else. Then they look at the distribution, not the mean, and find the long-tail events. Then they fix the parts problem, because in the majority of cases, the long tail is a parts-wait problem, not a technician-skill problem. Only after the tail is under control do they focus on reducing the typical repair time.
A practical 30/90/180-day roadmap:
30 days: Audit your current timestamp capture. Identify gaps. Add T1 through T5 to your work order template. Pull the last 12 months of repair data and sort by duration to find your top 10 long-tail events.
90 days: Pre-position spares for the top 5 failure modes driving long-tail events. Write runbooks for each. Set up a dashboard with mean, median, and 90th percentile MTTR by asset class.
180 days: Cross-train a second technician for each of your top 10 failure modes. Review and update your SLA language to match your actual measurement definition. Run a quarterly post-incident review cycle for any repair exceeding 3× median.
The 30-day step is the one teams skip most often because it feels administrative rather than operational. It is actually the highest-leverage investment in the sequence. You cannot reduce a number you are not measuring correctly.
Firmanager helps you track and reduce MTTR from one platform
Cutting MTTR requires accurate timestamps, fast dispatch, and parts visibility, and those three things rarely live in the same system. Firmanager brings them together in a single platform built for field service operations.
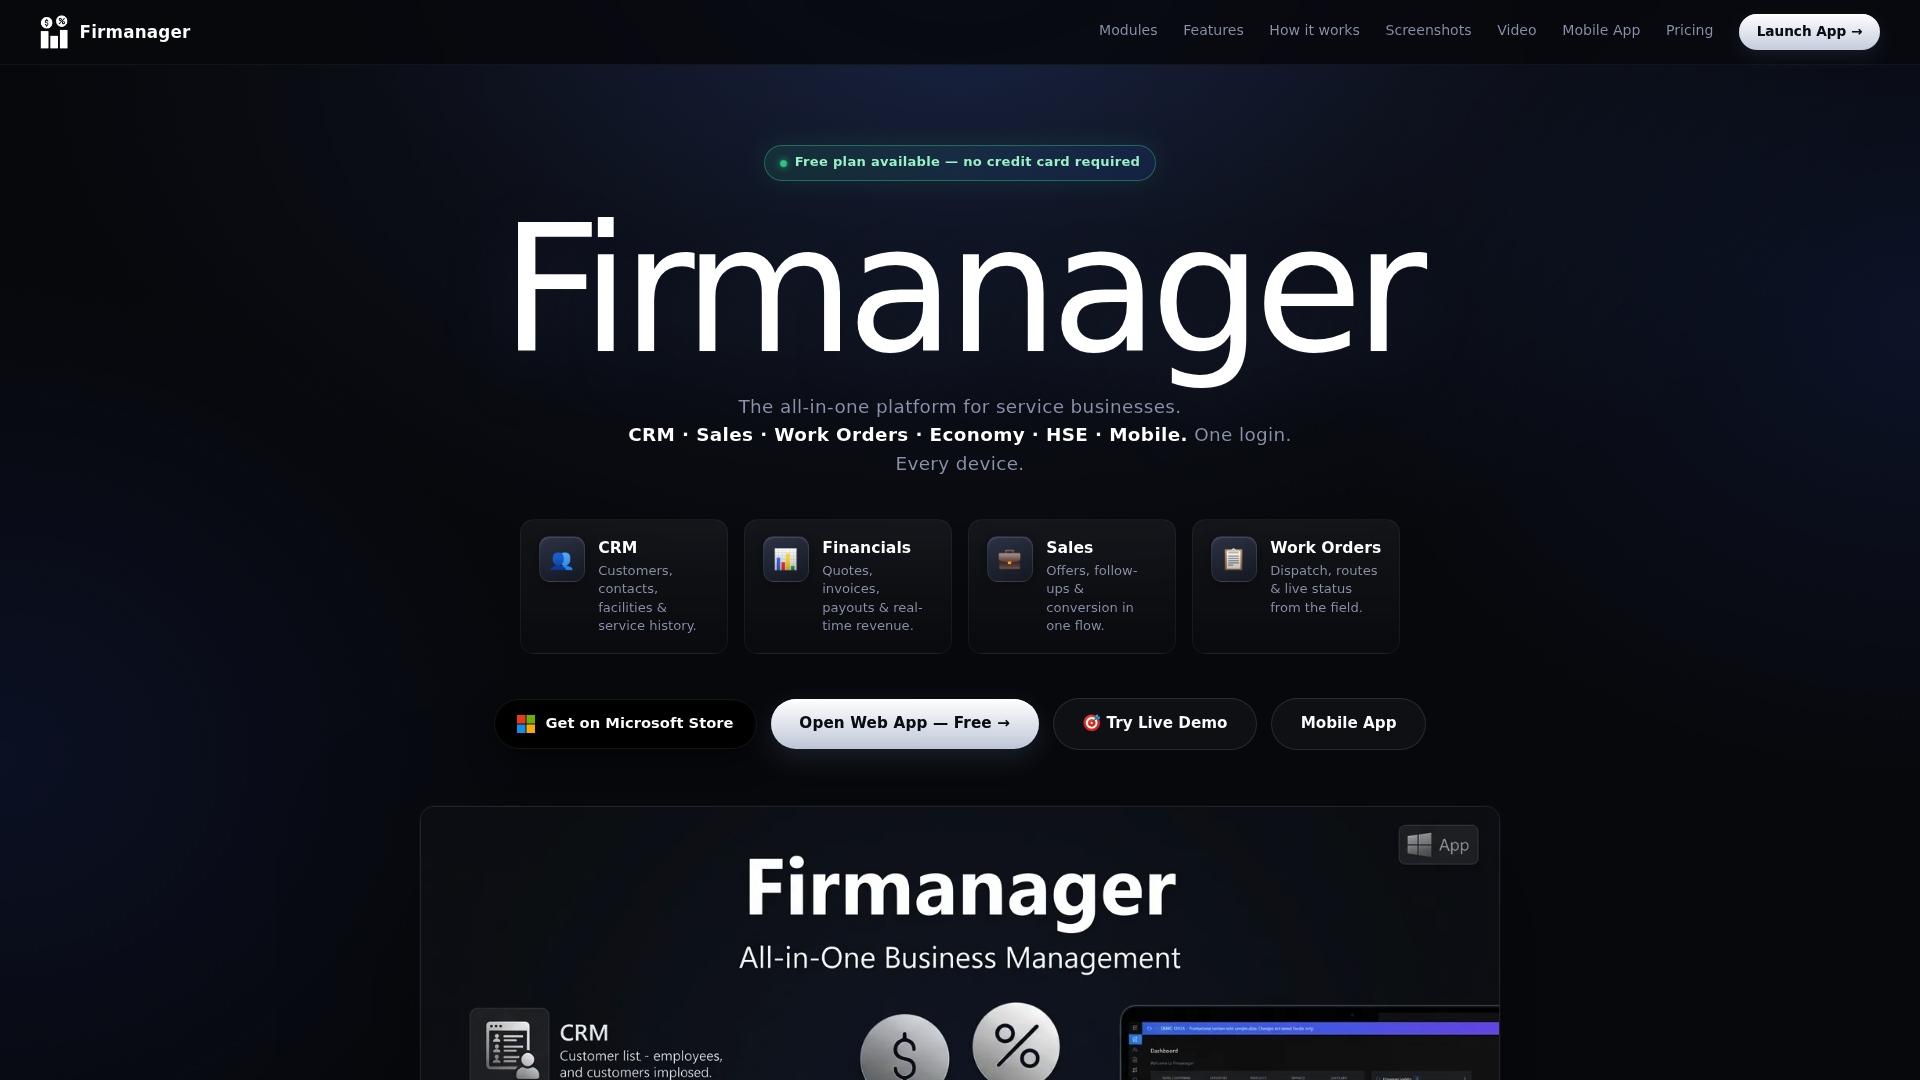
Work orders in Firmanager capture the full timestamp chain automatically: failure logged, technician assigned, on-site arrival, repair complete, and verification sign-off. That means your repair-only and recovery MTTR figures come from the same record with no manual reconciliation. The dispatch and route management module cuts response time by routing the nearest qualified technician, while the parts and supplier management module flags stock levels before a technician leaves the depot. Real-time analytics surface your mean, median, and long-tail repair events without a separate BI tool.
If you are ready to move from spreadsheet-tracked downtime to a dashboard that shows MTTR by asset class, technician, and failure mode, explore Firmanager’s platform and start a free trial today.
Sources
- What is MTTR? Mean Time To Repair Formula & SMRP Definition | TeepTrak
- Mean time to repair
- Common Incident Management Metrics | Atlassian
Recommended
Run your whole business in one place
CRM, quotes, work orders, invoicing, expenses, HR and HSE — one login, every device. Free-forever plan.
Start free →