How to Monitor Business Performance in a Service Company

To monitor business performance, pick a small set of measures tied to your goals, define each one in writing, assign an owner, and review them on a fixed schedule. Fast-moving field numbers get checked daily or weekly. Money and project numbers get checked monthly. Every review ends with a decision, not just a chart.
This guide walks through that process for service businesses such as maintenance, cleaning and technical services. It covers which KPIs to track, how to set baselines and targets, how often to review, how to read the results, and the mistakes that make dashboards useless.
TL;DR
- Start from goals. Choose one to three KPIs per business outcome, and balance financial, customer, operational and people measures.
- Write down each KPI’s definition, data source, owner and review frequency before you build any dashboard.
- Review operational measures daily or weekly, financial and project measures monthly, and long-term outcomes quarterly or yearly.
- Use target bands. Investigate yellow results, and log an action, an owner and a follow-up date for red results.
- Real-time job data from the field is what makes weekly reviews accurate. Firmanager keeps CRM, work orders, time, invoicing and HR in one cloud-synced platform.
Table of Contents
- Why monitoring performance matters in a service business
- Choose measures that reflect your goals
- KPIs worth tracking, grouped by area
- Set baselines and targets
- Collect, review and report on a schedule
- Use real-time field data to catch delays early
- Turn reports into improvements
- Common mistakes to avoid
- Our perspective
- Put your numbers in one place
- FAQ
- Sources
Why monitoring performance matters in a service business
Service companies sell time, skill and reliability. You can’t see those on a shelf, so you need numbers to know how the business is doing. McKinsey’s guidance on services describes performance monitoring as a prerequisite for finding efficiencies and spreading best practices across the company. The same guidance says service firms should account for differences in customer size, service type and contract terms, and collect data in a uniform way.
The point of a metric is not the number. Bain describes useful metrics as ones that align with and balance corporate priorities, can be measured accurately and benchmarked, and show employees how their actions connect to business needs. If a technician can’t see how a number moves because of their work, the number won’t change behavior.
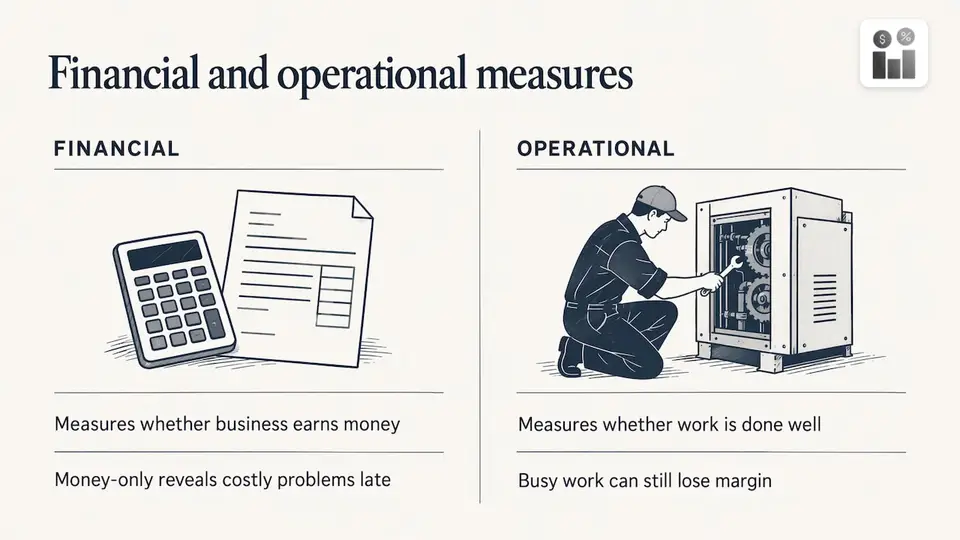
This is why monitoring has to look at two sides at once. Financial measures tell you whether the business earns money. Operational measures tell you whether the work is being done well. If you only watch money, you learn about problems after they cost you. If you only watch operations, you can be busy and still lose margin.
Choose measures that reflect your goals
Begin with the outcomes you want in the next 12 months. Typical examples for a field service company: keep more customers, collect cash faster, finish jobs on time, and keep crews busy with billable work. Then choose the measures that show progress toward each.
ServiceNow’s customer success guide recommends one to three KPIs per business outcome. It also advises separating outcome KPIs (what the business gets) from implementation KPIs (what you did to get there), for example “customer retention” versus “percentage of jobs with a completed checklist.”
Keep the list short. McKinsey’s summary reports that three to five metrics often track about 80 percent of cost variance in service businesses. A short list is easier to explain, easier to own and harder to ignore.
If your website also generates leads, give it a place in the plan. A guide on choosing website KPIs and tools shows how to pick measures for that channel without drowning in data.
KPIs worth tracking, grouped by area
Use the table as a menu, not a checklist. Pick the few that match your goals.
| Area | Example KPIs | What it tells you | Typical review |
|---|---|---|---|
| Financial | Revenue, gross margin, days sales outstanding (DSO), operating cash flow | Whether work turns into cash | Monthly |
| Service delivery | On-time completion, first-visit completion, rework rate, cycle time | Whether jobs are done well and promptly | Daily or weekly |
| Utilization | Billable hours versus available hours | Whether paid time becomes revenue | Weekly |
| Projects | Schedule variance, budget variance, milestone completion | Whether larger jobs are on track | Weekly or monthly |
| Customers | Retention or churn, repeat work, satisfaction score | Whether customers come back | Monthly or quarterly |
| People | Turnover, time to fill open roles, training hours, safety measures | Whether you can staff the work | Monthly or quarterly |
Financial and utilization measures
One CFO-focused guide for professional services lists six core numbers: portfolio margin, realization rate, utilization rate, labor-loaded gross margin, billing lag and DSO. It also makes a point field managers will recognize: low utilization this month means low billing next month, which becomes a cash problem the month after.
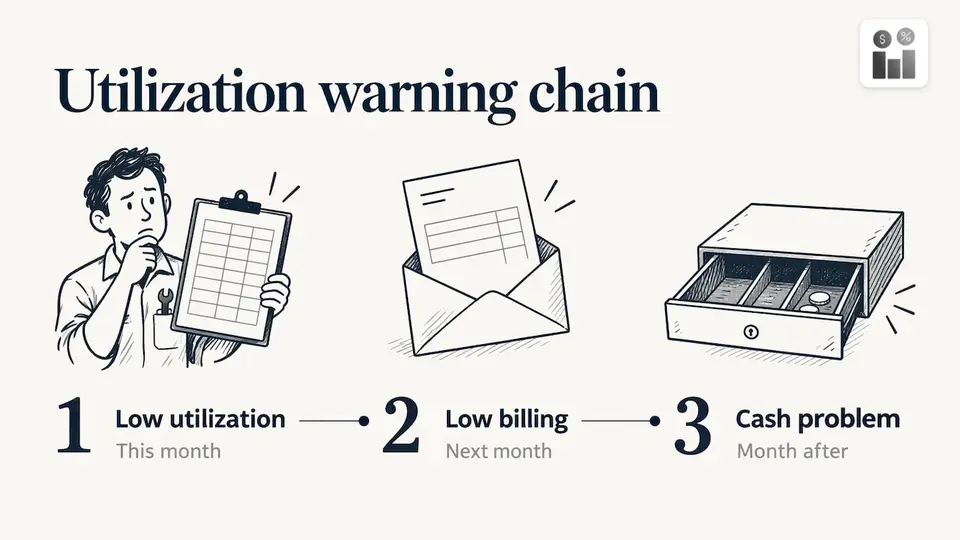
That chain is why we treat utilization and time capture as early-warning measures. Our guides on technician utilization and technician time tracking show how to measure both and close billable gaps.
Project measures
For longer jobs and installs, useful project KPIs include on-time delivery, schedule variance, budget variance, milestone completion, a project-health score and how often change requests come in. Budget variance is the one that most often protects margin: compare the quote with the actual labor and materials as the job runs, not after it closes.
Customer and people measures
Customer retention and repeat work show whether your service quality holds up over time. People measures matter because service delivery depends on staffing: turnover, time to fill open positions and training hours all affect how many jobs you can accept. Where your work carries risk, add safety-related measures such as incidents and completed inspections. Firmanager includes HSE compliance tracking, so these can sit next to your work orders.
Set baselines and targets
A KPI without a baseline is a number with no meaning. Before you set a target, measure the current state for a few weeks. ServiceNow’s guide recommends defining a baseline and phased targets, then revisiting measures at the end of each phase.
A practical way to do it:
- Measure the baseline. Pull four to eight weeks of data for each KPI.
- Set a target band, not a single line. Define green (on target), yellow (drifting) and red (off track) ranges.
- Phase the target. Aim for a realistic gain over a quarter, then raise it.
- Reassess. Drop or redefine any measure that nobody uses to make a decision.
Define every KPI in writing
BetterEvaluation recommends fully defining each indicator: what is measured, how, how often, how the data is stored, how to interpret it and how users are trained. It also suggests pilot-testing new indicators and reassessing their usefulness from time to time.
A one-line definition card per KPI is enough:
- Name: On-time completion rate
- Formula: Jobs finished within the scheduled window divided by jobs scheduled
- Source: Work order status and completion timestamps
- Owner: Operations manager
- Review: Weekly
Standard definitions matter for trust. ServiceNow notes that inconsistent definitions, especially for qualitative measures such as customer satisfaction, undermine data quality and trust. If one supervisor counts a job as “on time” when the technician arrives and another when the job is finished, your trend line is noise.
Collect, review and report on a schedule
A U.S. government best-practices guide on performance measurement says information should reach decision-makers quickly. It also says review frequency can range from daily or weekly to monthly, quarterly or annually depending on the activity and the information need. A sensible cadence for a service company:
- Daily or weekly: jobs completed, delays, open work orders, technician utilization, overdue tasks.
- Monthly: revenue, margin, invoicing and collections, project budget variance.
- Quarterly or yearly: customer retention, turnover, strategic targets.
The same guide points to a documented collection plan: a credible source, consistent definitions, a calculation method, a named data owner, quality checks and fast access. ACCA and KPMG add that effective reporting gives management timely information it can act on and uses comparators continuously to test whether indicators are still relevant.
What a good report looks like
Show the trend, not a single point. Show the target next to the actual. Add one sentence of context: what changed and why. A report that the audience can’t act on is a report nobody reads. For a view built around exceptions, see our guide to field service dashboards.
Use real-time field data to catch delays early
Monthly reports tell you what happened. Field service also needs to know what is happening today. When job status lives in phone calls, texts and spreadsheets, a delay reaches the office after the customer has already called.
With one cloud-synced platform, the data flow changes:
- Technicians update jobs from their phones. The employee mobile portal gives them job details, and status changes reach the office as they happen.
- Dispatchers see the schedule as it is. Route and dispatch management lets you reassign a job when a technician runs late.
- Notifications go out automatically. Real-time SMS and email notifications keep customers and staff informed.
- Time and work orders feed the same reports. Hours logged on a job flow into utilization and invoicing without re-entry.
Bad job data produces bad routes and bad reports, so clean inputs come first. Our piece on route planning for technicians explains how managers fix job data before choosing software. For maintenance teams, the work order process guide covers how to move from reactive firefighting to tracked, measurable work.
Turn reports into improvements
A review is only useful if it changes something. One operating model for service businesses uses named metric owners, written definitions and target bands, a weekly review, and a decision protocol: a yellow result triggers investigation, and a red result triggers a documented action with an owner and a follow-up date.
Here is how that looks in a 30-minute weekly meeting:
- Open the dashboard and read the red and yellow items first. Skip the greens.
- For each yellow item, assign someone to find the cause before next week.
- For each red item, write the action, the owner and the date you will check it.
- Start the next meeting by reviewing last week’s actions.
Look for root causes, not only costs. McKinsey’s service guidance recommends going beyond financial costs to root causes and using cost systems that show cross-functional trade-offs. A late invoice might trace back to missing time entries, which trace back to technicians who close jobs at the end of the week. The fix is a process change, not a collections call.
Common mistakes to avoid
- Tracking too many measures. If nobody can name your top five, you have too many.
- Vague definitions. Two people calculating the same KPI two ways destroys trust in the report.
- Only financial metrics. Revenue tells you about last month. Operational measures tell you about next month.
- No owner. A KPI without a named person tends to go unreviewed.
- Reports without decisions. Every review should end with an action, an owner and a date.
- Data in many places. When CRM, scheduling, time and invoicing don’t connect, someone rebuilds the report by hand every week, and it is already out of date when it is done.
- Never revisiting the list. As the business changes, drop measures that no longer drive decisions.
Our perspective
We built Firmanager on one belief: you can’t monitor what you can’t see, and you can’t see what lives in five separate tools. When CRM, work orders, invoicing and HR sit behind one login, a job closed in the field shows up in utilization, in billing and in your reports without anyone retyping it.
That is why our modules are designed to share data. A work order links to the customer and facility, the time logged against it, the invoice that follows and the compliance records that apply. Real-time sync is meant to make your weekly review a look at what is true now, not a reconstruction of last month.
We also think monitoring should fit the size of your business. You can start with the modules you need and add others as your questions grow. Start with three to five measures, review them every week and let the data decide what to improve next.
KaiosMedia
Put your numbers in one place
Firmanager is an all-in-one platform for service businesses, with CRM, work orders and field service management, time and leave tracking, invoicing with Stripe integration, financial management with real-time analytics, HSE compliance and an employee mobile portal. Everything runs under a single login on any device.
Plans are published as Free at $0, Pro at $19 per month and Business at $49 per month. You can compare the plans and start on the Free plan and connect your first work orders this week, or open the Firmanager app if you already have an account.
FAQ
How many KPIs should a small service business track?
Start with three to five. ServiceNow recommends one to three KPIs per business outcome, and McKinsey’s summary reports that three to five metrics often track about 80 percent of cost variance in service businesses. Add more only when a new measure will change a decision.
How often should I review business performance?
It depends on the measure. A U.S. government performance guide says review frequency can run from daily or weekly to monthly, quarterly or annually. For a service company, that usually means weekly for field operations, monthly for financial and project results, and quarterly for retention and people measures.
What is the difference between financial and operational KPIs?
Financial KPIs, such as margin, DSO and cash flow, show whether work turns into money. Operational KPIs, such as on-time completion, utilization and rework, show how well the work is being done. You need both, because operations drive next month’s financial results.
What should I do when a KPI turns red?
Write down an action, an owner and a follow-up date, then check it at the next review. For yellow results, investigate the cause first. This yellow-and-red protocol comes from a service-business operating model and keeps reviews from turning into talk without follow-through.
Sources
- How to Measure the Metrics that Matter, Bain
- Measuring Performance in Services, CFO.com
- Performance, KPIs, and Metrics Guide, ServiceNow
- Key Performance Indicators, BetterEvaluation and ANZSOG
- Serving the American Public: Best Practices in Performance Measurement
- Performance Reporting: an eye on the facts, ACCA and KPMG
- PS Financial Reporting: Metrics Your CFO Should Be Tracking
- Professional services KPIs: 30 metrics that actually matter
- The KPI reporting system every growing service business needs
- How to measure website success: KPIs, tools, and pro tips
Recommended
Run your whole business in one place
CRM, quotes, work orders, invoicing, expenses, HR and HSE — one login, every device. Free-forever plan.
Start free →