Stop Van Stockouts: Parts Reorder Points That Keep Technicians Working

Stop Van Stockouts: Parts Reorder Points That Keep Technicians Working
A parts reorder point (ROP) is the on-hand quantity that triggers a new order, timed so replenishment arrives before you run out. The formula is straightforward: ROP = (average daily demand × lead time) + safety stock. Get the units wrong, on the other hand, and the number looks precise while quietly guaranteeing a stockout.
TL;DR:
- Using average lead time in the ROP formula can cause stockouts during demand or supply spikes if lead time variability is ignored.
- Reorder points protect against stockouts during lead time but do not determine order quantity, which affects inventory levels and costs.
- Safety stock calculation methods should match demand patterns, with statistical, max-method, or days-of-cover approaches suited to different part behaviors.
- Standard safety formulas often fail with lumpy or intermittent demand, requiring specialized models like Croston’s or simple heuristics like two-bin systems.
- Regularly review and update reorder points based on demand shifts, supplier performance, and operational needs to avoid stale or inaccurate inventory triggers.
Table of Contents
- Parts Reorder Points: Key Takeaways
- What a Reorder Point Actually Controls
- The Reorder Point Formula, Term by Term
- Choosing the Right Safety Stock Method
- Reorder Points for Spare Parts and Lumpy Demand
- Two Worked Reorder Point Calculations
- Spreadsheets, Software, and Making Reorder Points Automatic
- Where Reorder Point Calculations Usually Break
- How Often You Should Recalculate Reorder Points
- Firmanager Pilot Insights: Van Stock and Depot Parts
- The Trade-Off Nobody States Plainly
- Automate Parts Reorder Points With Firmanager
- Sources
- FAQ
Parts Reorder Points: Key Takeaways
Before you touch a spreadsheet, run through this list. Most reorder point failures trace back to one of these being wrong or ignored.
- Formula check: ROP = (average daily demand × lead time in days) + safety stock. Confirm demand and lead time use the same time unit before you multiply anything.
- Conservative sizing: For critical or single-source parts, use the max-method (maximum daily usage × maximum lead time) instead of averages.
- Monitoring: Track your actual service level against target, and reconcile on-order quantities weekly so the system isn’t double-counting stock that already shipped.
- Automation fields: Keep on-hand count, on-order count, lead time, average daily demand, and safety stock current in whatever system triggers your purchase orders.
One detail trips up more managers than any formula error: using average lead time when lead-time variability is the real threat. If a supplier’s typical lead time is 7 days but occasionally stretches to 14, an average-based ROP will stock out during every spike.
Pro Tip: If you only have time to fix one input this quarter, fix lead time. Demand forecasts drift slowly; lead-time surprises hit fast and empty a shelf overnight.
What a Reorder Point Actually Controls
A reorder point answers one question: when do you place the order? It doesn’t tell you how much to order. That’s a separate calculation, usually handled by economic order quantity (EOQ) or a fixed max level in a min/max system.
Confusing the two is common. A manager who says “we need a higher reorder point” sometimes actually means “we need a bigger order quantity.” The reorder point protects you against running dry during the lead-time window. The order quantity determines how efficiently you replenish once you’ve decided to order. Mixing these up leads to either chronic understocking (correct trigger timing, but too little ordered each time) or bloated carrying costs (ordering plenty, but at the wrong moment).
Think of ROP as a service-level commitment translated into a number. Set it too low and you save on carrying cost but risk a technician standing at a job site without the part. Set it too high and you’re financing inventory that sits on a shelf earning nothing.
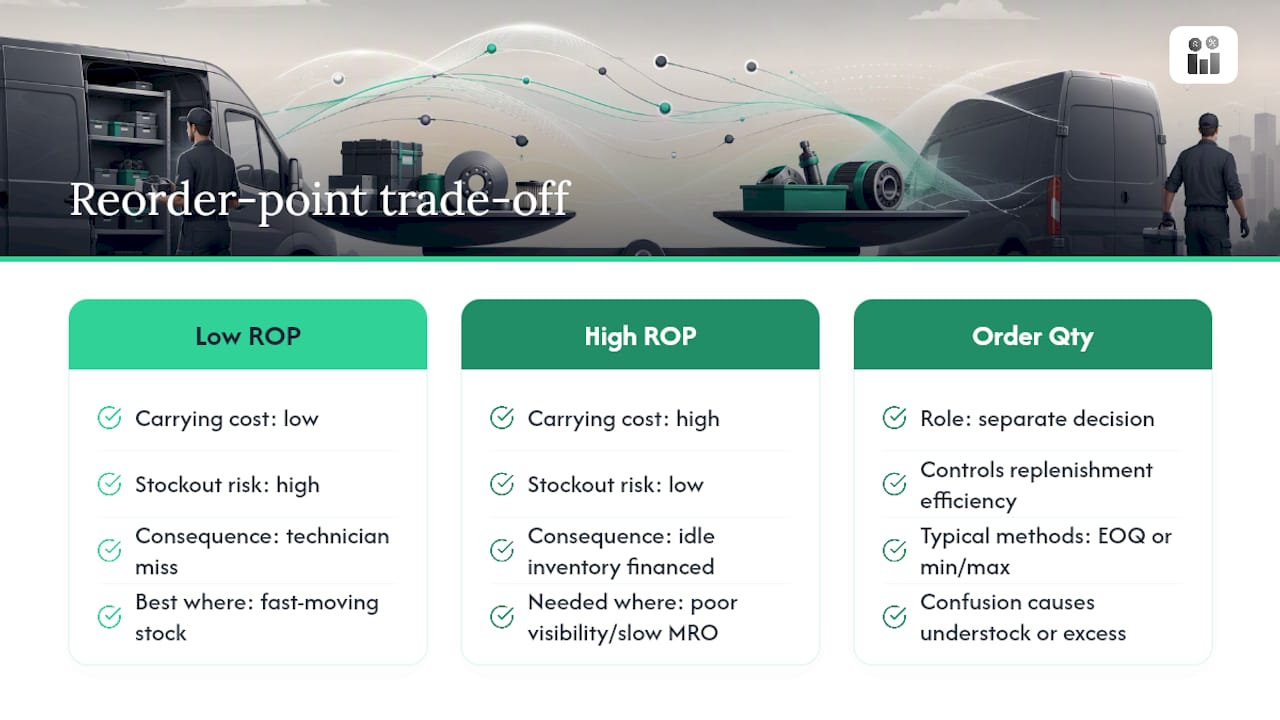
The application also differs by location. A fast-moving gasket sitting on a warehouse shelf can tolerate a tighter reorder point because replenishment is predictable and visibility is good. A van stocked with spare parts for field technicians, or a depot holding slow-moving MRO items, needs a different calculation entirely, because visibility is worse and consequences of a miss are immediate. That distinction drives most of the special-case guidance later in this piece.
The Reorder Point Formula, Term by Term
The canonical formula is simple to write and easy to miscalculate: ROP = (average daily demand × lead time in days) + safety stock. Each term deserves its own scrutiny before you trust the output.
- Average daily demand. Pull usage history from a rolling window, typically 30, 60, or 90 days, and convert everything to a daily figure. If your system reports weekly consumption of 840 units, divide by seven to get 120 units per day. Use a rolling average rather than a single lookback month, since one unusually slow or busy month will distort a static figure.
- Lead time. Measure the full span from placing the order to having the part available for use, not just “ships in 3 days.” Include supplier processing time, transit, and your own receiving and put-away delay. If receiving typically adds a day before parts are scanned into the system, that day belongs in your lead time.
- Safety stock. This is the buffer against variability in both demand and lead time. Calculating it correctly is involved enough that it gets its own section below.
Unit and calendar mismatches cause more bad reorder points than any other single error. If your demand figure is in units-per-week and your lead time is in calendar days, you have to convert one before multiplying. The same applies to working days versus calendar days: a supplier that quotes lead time in business days will actually take longer in calendar time once weekends are factored in, and your ROP needs to reflect the calendar reality, not the quoted one.
Data source selection matters too. Pulling average daily demand from point-of-sale or work-order-completion data (when the part was actually consumed) gives a cleaner signal than pulling from purchase-order dates, which reflect when you ordered, not when you used the part. If those two diverge, and they usually do, your formula is only as good as the demand data feeding it.
Pro Tip: Build a simple sanity check into your spreadsheet: flag any SKU where the calculated ROP is lower than one week of average demand. That’s almost always a data problem, not a genuinely fast-turning part.
Choosing the Right Safety Stock Method
Safety stock is where most reorder point calculations go wrong, because managers pick a method that doesn’t match how the part actually behaves. Three approaches cover the vast majority of real-world cases.
The statistical method uses a Z-score multiplied by the standard deviation of demand during lead time: Safety Stock = Z × SD. A Z value near 1.65 corresponds to roughly 95% service level, while 2.33 pushes you toward 99%. This method works well for parts with steady, fairly continuous demand and a large enough sample size to calculate a meaningful standard deviation. It performs poorly on parts that only move a few times a month, because the standard deviation itself becomes unstable with so little data.
The max-method takes a more conservative, less mathematically elegant approach: Safety Stock = (maximum daily usage × maximum lead time) minus (average daily usage × average lead time). This method suits critical spares, single-source parts, or anything where a stockout stops a truck or a repair job. It tends to overstock compared to the statistical method, but for parts where the cost of running out dwarfs the cost of carrying extra inventory, that trade-off is the right one.
Days-of-cover heuristics work for smaller operations without the data history to run either formula properly. Set safety stock as a fixed number of days of average demand, say five or ten, and adjust by feel as you gather more history. It’s not sophisticated, but it beats guessing, and it’s often where teams should start before layering in statistical rigor.
| Method | Best fit | Data needed | Tends to |
|---|---|---|---|
| Statistical (Z × SD) | Steady, high-volume parts | 60+ days of demand history | Right-size buffer, minimize excess |
| Max-method | Critical, single-source, or safety-relevant parts | Max and average usage/lead time | Overstock intentionally |
| Days-of-cover | Low-data or new operations | Minimal, just average demand | Approximate, needs manual tuning |
Deciding which one dominates for a given SKU comes down to a single question: is the volatility mostly in demand, or mostly in lead time? If your supplier is rock solid but demand swings wildly week to week, the statistical method captures that variability well. If demand is steady but your supplier occasionally goes dark for three extra weeks, no demand-side formula will save you. That’s a lead-time problem, and it calls for either the max-method or an explicit lead-time buffer added on top of a standard safety stock calculation.
Reorder Points for Spare Parts and Lumpy Demand
Standard safety stock formulas assume demand looks roughly like a bell curve; steady, with predictable ups and downs. Spare parts and MRO items rarely behave that way. A bearing might sit untouched for six weeks, then get used four times in a single week when a machine fails. This pattern is called lumpy or intermittent demand, and running a standard deviation calculation on it produces a number that looks precise but describes nothing real.

Croston’s method and Poisson-based order-point models were built specifically for this problem. Rather than forecasting a smooth daily rate, they separate the demand signal into “how often does this part get used” and “how much gets used each time,” then combine those into an order point that targets a specific service rate. Many enterprise inventory-planning modules now include a dedicated slow-mover or Croston option precisely because standard formulas fail on this class of parts.
If you don’t have access to that level of modeling, simpler heuristics still beat guessing:
- Two-bin systems: Keep two containers of the part; when one empties, reorder while working from the second, resetting the clock without a calculation.
- Criticality-based min/max: Set higher minimums for parts tied to safety or uptime, even when usage data suggests you could run leaner.
- Segmented service targets: Group SKUs by how often they’re used and apply looser rules to genuinely rare parts, saving the rigorous math for items that see regular action.
Pro Tip: Don’t run one reorder-point method across your entire catalog. Segment first, by demand pattern and by criticality, then apply the model that actually fits each group. A single global formula is usually wrong for at least half your parts.
Two Worked Reorder Point Calculations
Numbers make this concrete.
- Gather raw data: 90 days of usage shows 10,800 units consumed.
- Calculate average daily demand: 10,800 ÷ 90 = 120 units per day.
- Confirm lead time: Supplier confirms order-to-availability takes 7 days, including receiving.
- Calculate lead-time demand: 120 × 7 = 840 units.
- Calculate standard deviation of daily demand: Historical data shows a standard deviation of about 25 units per day; over a 7-day lead time, that scales to roughly SD√7 ≈ 66 units.
- Apply the Z-score: 1.65 × 66 ≈ 109 units of safety stock, rounded up for a conservative buffer.
- Final ROP: 840 + 109 = 949 units, or roughly 950 rounded for a practical purchase order trigger.
This mirrors the structure MFG Calcs uses in its own reference example: 120 units/day × 7 days lead time gives 840 units of lead-time demand, and adding a safety stock figure produces the final trigger point.
A lumpy-demand spare part looks different. Say a hydraulic valve gets used only 9 times over the past year, in quantities ranging from 1 to 3 units per event, with no clear pattern. Running a standard deviation on daily demand here is close to meaningless, since most days show zero usage. Instead, apply a max-method approach: if the longest gap between an order being placed and the part being available was 21 days, and the highest observed usage in any 21-day window was 4 units, set the reorder point at 4, maybe 5 with a small margin. It’s not statistically elegant, but it matches how the part actually behaves.
| Input | Steady-demand SKU | Lumpy-demand SKU |
|---|---|---|
| Method | Statistical (Z × SD) | Max-method |
| Average daily demand | 120 units/day | Not meaningful (intermittent) |
| Lead time | 7 days | 21 days (worst case observed) |
| Safety stock | ~109 units | Built into max usage figure |
| Final ROP | ~950 units | 4 to 5 units |
Once you have the ROP, the min/max replenishment quantity follows naturally: set your minimum at the ROP and your maximum at whatever level makes sense given order cost and storage. The min/max approach pairs directly with these calculations, since the minimum is just your reorder point and the system orders up to the maximum whenever inventory touches it.
Spreadsheets, Software, and Making Reorder Points Automatic
Most teams start in a spreadsheet, and that’s a reasonable place to begin as long as you build in validation from day one. Conditional formatting in Excel can flag unit mismatches, stale averages, and negative or implausible ROPs before they ever reach a purchase order. Set a rule that highlights any row where the ROP is below five days of average demand, and you’ll catch most data errors before they cause a stockout.
Spreadsheets get harder to trust as your parts catalog grows past a few hundred SKUs, or once multiple people update inventory counts from different locations. That’s usually the point where a min/max or automated reorder system in dedicated software starts paying for itself, because the calculation runs continuously against live on-hand data instead of a snapshot someone remembered to update last Tuesday.
Whichever system you use, keep these fields accurate, since a reorder trigger is only as good as its inputs:
- On-hand quantity, reconciled against actual counts, not just system-recorded receipts and issues.
- On-order quantity, so the system doesn’t fire a duplicate purchase order for stock already in transit.
- Lead time, updated when a supplier’s performance shifts, not left at whatever value was entered at setup.
- Average daily demand, recalculated on a rolling basis rather than fixed once and forgotten.
- Safety stock and reorder quantity, reviewed by SKU class rather than applied uniformly.
Two-bin workflows deserve a mention here because they sidestep a lot of this complexity for high-volume, low-value parts. Instead of calculating a precise ROP, you just count on the physical trigger: bin empties, reorder happens. It’s a fine substitute for formal ROP math on parts where the cost of getting the number exactly right isn’t worth the analyst time.
Before rolling out any automated trigger to your full catalog, test it against a handful of known scenarios. Feed the system a SKU with a known demand spike and confirm the reorder fires at the expected point, not early, not late. Field-service operations running mobile van stock benefit especially from this kind of dry run, since a bad trigger there means a technician showing up to a job without the part, not just a delayed warehouse restock.
Where Reorder Point Calculations Usually Break
Most bad reorder points share a small set of root causes, and catching them early saves far more time than recalculating after a stockout.
- Unit mismatch: Demand in weekly units multiplied against a daily lead time, or vice versa, without converting first.
- Stale averages: A reorder point calculated once during setup and never revisited, even as usage patterns shift.
- Ignoring lead-time spikes: Using average lead time when variability in that lead time is what’s actually causing the stockouts.
- One-size-fits-all ROPs: Applying the same formula and safety stock logic across fast movers, slow movers, and critical spares, when each needs its own approach.
Validation should include a reconciliation step against receiving records. If your system says a part had a 5-day lead time but receiving logs show it consistently took 9, your ROP has been undersized this entire time without anyone noticing.
Pro Tip: Watch fill rate, stockouts per SKU, and days-of-cover drift as your three early-warning KPIs. A dropping fill rate on a specific SKU almost always traces back to one of the four mistakes above, not bad luck.
How Often You Should Recalculate Reorder Points
Reorder points are not a set-and-forget number. Many operations recalibrate on a quarterly or seasonal basis, but the right cadence depends on SKU class.
- Fast-moving, high-volume parts: Review monthly, since demand shifts here compound quickly.
- Slow-moving and critical spares: Review quarterly, unless a specific event forces an earlier look.
- Any SKU after a supplier lead-time change: Recalculate immediately, don’t wait for the next scheduled cycle.
- Any SKU after a sustained demand spike or drop: Adjust as soon as the new pattern is confirmed, not assumed to be temporary.
Ownership matters as much as timing. Assign a specific inventory owner responsible for the numbers, a procurement contact who flags supplier lead-time changes as they happen, and a warehouse liaison who reconciles physical counts against system records. Audit against service level targets and, where relevant, against how parts availability affects repair time.
Firmanager Pilot Insights: Van Stock and Depot Parts
A 30-day van stock management pilot run through Firmanager gives a useful window into how reorder points behave outside the warehouse. The setup focused on syncing van inventory counts in real time via mobile devices, then letting reorder triggers fire based on actual consumption logged at the job site rather than periodic manual counts.
A related deep dive into parts inventory control for maintenance teams showed how depot stock and van stock often need distinct reorder logic even for the same part number, since depot parts benefit from steadier demand signals while van stock behaves more like the lumpy-demand case described earlier.
A few patterns from these cases apply broadly:
- Sync consumption data as close to real time as possible, since delayed logging inflates apparent lead time and skews the reorder trigger.
- Separate ROP calculations for the same SKU by location when demand patterns genuinely differ between depot and field.
- Reconcile on-hand counts on a fixed cadence rather than only when something runs out.
The Trade-Off Nobody States Plainly
Every reorder point is a bet on which failure you’d rather have: money sitting idle on a shelf, or a technician standing at a job site without the part. Most guidance dodges this by pretending a perfectly tuned formula avoids both. It doesn’t. You’re choosing where the risk sits.
For parts tied directly to uptime or safety, that choice should be made in advance, not discovered during a crisis. Err toward the max-method, accept the extra carrying cost, and treat it as insurance against a mean-time-to-repair spike that costs far more than the inventory does. For high-volume, low-consequence parts, optimize for cash instead. The statistical method and tighter service levels make sense there, because the downside of an occasional short delay is genuinely small.
The mistake I see most often isn’t a bad formula. It’s applying the same risk tolerance to every part number, when the actual cost of getting it wrong varies by an order of magnitude across a typical parts catalog.
— KaiosMedia
Automate Parts Reorder Points With Firmanager
A comprehensive platform can bring parts catalog management, mobile van-stock sync, and purchase order automation into one login, so reorder points calculated on a spreadsheet don’t stay stuck there. Supplier and product records can stay linked to real-time on-hand and on-order data across devices, resolving the reconciliation issues that trip up most manual systems.

Field technicians can log parts usage via a mobile app at the moment stock is consumed, feeding consumption data directly into shared records to reduce lag that causes reorder points to drift out of date. Financial and analytics modules may allow tracking of fill rate and reorder frequency by SKU without exporting data to separate tools.
If you’re managing reorder points across a mixed fleet of vans, a depot, and a growing parts catalog, start with the Free plan to test the parts and work order modules against your own data, then move to Pro at $19 per month or Business at $49 per month as your reorder automation needs grow.
Sources
The calculations and models in this guide draw on a small set of sources worth bookmarking if you want to dig deeper into the math or the software side.
- Reorder Point Formula & Calculator | MFG Calcs
- INFORMS - intermittent demand research
- Inventory Planning and Replenishment (IPR) documentation
- The Benefits of Min/Max Inventory (eTurns)
FAQ
What is a reorder point?
A reorder point is the on-hand inventory level that triggers a replenishment order, calculated as average daily demand multiplied by lead time, plus safety stock. It’s designed so the new order arrives before existing stock runs out, based on the standard formula.
How do I calculate a reorder point?
Multiply your average daily demand by lead time in days to get lead-time demand, then add a safety stock buffer.
What is EOQ and how does it relate to ROP?
Economic order quantity (EOQ) determines how much to order each time, while the reorder point determines when to place that order. The two work together: EOQ sets your order size, and ROP sets the trigger that tells you it’s time to place it.
What is FIFO, LIFO, and JIT, and how do they relate to reorder points?
FIFO (first in, first out) and LIFO (last in, first out) are inventory valuation and rotation methods, while JIT (just-in-time) is a replenishment philosophy that minimizes safety stock in favor of tightly timed deliveries. JIT systems rely on very reliable, short lead times, since a low or near-zero safety stock buffer leaves little room for supplier delays, whereas safety-stock-heavy systems trade some carrying cost for protection against those delays.
How often should I recalculate reorder points?
Fast-moving parts warrant a monthly review, while slower-moving or critical spares can typically go on a quarterly cycle. Any supplier lead-time change or sustained demand shift should trigger an immediate recalculation rather than waiting for the next scheduled review.
Recommended
Run your whole business in one place
CRM, quotes, work orders, invoicing, expenses, HR and HSE — one login, every device. Free-forever plan.
Start free →