Field Service Managers: Service Capacity Planning Across 3 Horizons
Field Service Managers: Service Capacity Planning Across 3 Horizons
Service capacity planning is the process of matching available people, equipment, and time slots to expected customer demand so you hit service levels without overstaffing or burning out your team. Done right, it runs on a loop: forecast demand, calculate usable capacity, act on the gap, and monitor results. Get that loop working, and SLA misses and idle payroll both drop.
TL;DR:
- Most capacity planning failures stem from weak monitoring and treating plans as static, rather than maintaining continuous, real-time adjustments.
- Using a basic forecast model like Prophet can deliver reliable short-term demand estimates that are easy to explain to non-technical stakeholders.
- Filling capacity gaps through schedule reshaping, cross-training, or subcontracting is often more effective and faster than immediate hiring, unless the gap persists across multiple cycles.
- Integrating planning tools with real-time dispatch, work order management, and financial systems ensures capacity planning directly translates into operational results.
Table of Contents
- What Are the Three Levels of Service Capacity Planning?
- How Do You Build a Service Capacity Plan?
- Which Demand Forecasting Method Should You Use?
- What Metrics Actually Drive Capacity Decisions?
- How Do You Calculate Field Service Capacity?
- What Tools Support Accurate Capacity Planning?
- How Do You Roll Out a Capacity Planning Program?
- Where Most Capacity Plans Actually Break Down
- Turn Your Capacity Plan Into a Running Operation
- Sources
- FAQ
What Are the Three Levels of Service Capacity Planning?
Capacity planning isn’t one decision. It’s three, made at different speeds and by different people. Getting them confused is the fastest way to make a good tactical call that quietly wrecks your strategic plan.
Strategic capacity planning covers 12 to 24 months. It answers questions like whether you need a new territory hub, a fleet expansion, or a new certification track for technicians. Finance and ops leadership own this level, and it’s usually reviewed once or twice a year.
Tactical planning works on a 3 to 12 month horizon. This is where you decide seasonal hiring, subcontractor agreements, and training rotations. It responds to contract wins, seasonal spikes, and churn forecasts, and it typically gets revisited every quarter.
Operational planning is the day-to-day and week-to-week layer: shift assignments, dispatch routing, and same-week schedule fixes when three technicians call in sick. This is the level dispatchers and team leads manage constantly, often daily.
All three levels touch the same scope, people, equipment, time slots, and the service-level agreements (SLAs) that define acceptable response and completion times. The mistake most organizations make is running operational fixes as if they solve strategic gaps. A chronic backlog isn’t a scheduling problem. It’s usually a strategic capacity problem wearing a tactical disguise.
How Do You Build a Service Capacity Plan?
A reliable capacity plan follows five connected steps, and skipping any one of them breaks the chain.
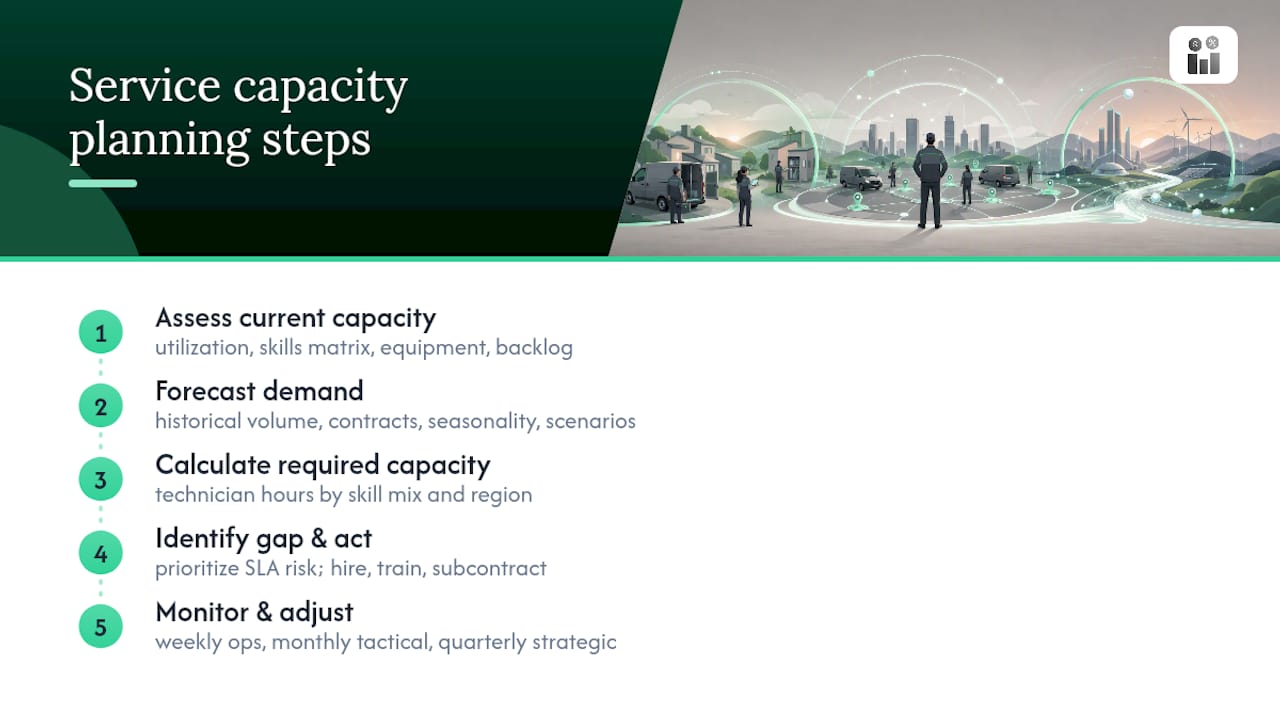
Assess current capacity. Pull utilization rates, a skills matrix showing who’s certified for what, your equipment inventory, and current backlog age. This is your baseline, and most teams underestimate how outdated theirs is until they actually pull the numbers.
Forecast demand. Combine historical service volume with known contract changes, seasonal patterns, and marketing or sales pipeline signals. Build at least two scenarios, a baseline and a stretch case, so you’re not planning against a single guess.
Calculate required capacity. Convert forecasted demand into required technician hours, factoring skill mix and territory coverage. This step produces a number: how many qualified people, with which certifications, in which regions, for how many hours.
Identify the gap and act. Compare required capacity against current capacity. Where the required hours exceed what you have, prioritize by SLA risk first and revenue impact second. Interventions range from hiring and cross-training to subcontracting or adjusting shift patterns.
Monitor and adjust. This isn’t a final step so much as a permanent one. Capacity planning is a continuous loop that ties telemetry, forecasting, and provisioning together rather than a task you close out and file away. Weekly operational reviews, monthly tactical check-ins, and quarterly strategic resets keep the plan honest.
Which Demand Forecasting Method Should You Use?
Model choice depends on your data history, your forecast horizon, and whether your planners need to explain the number to a skeptical finance team.
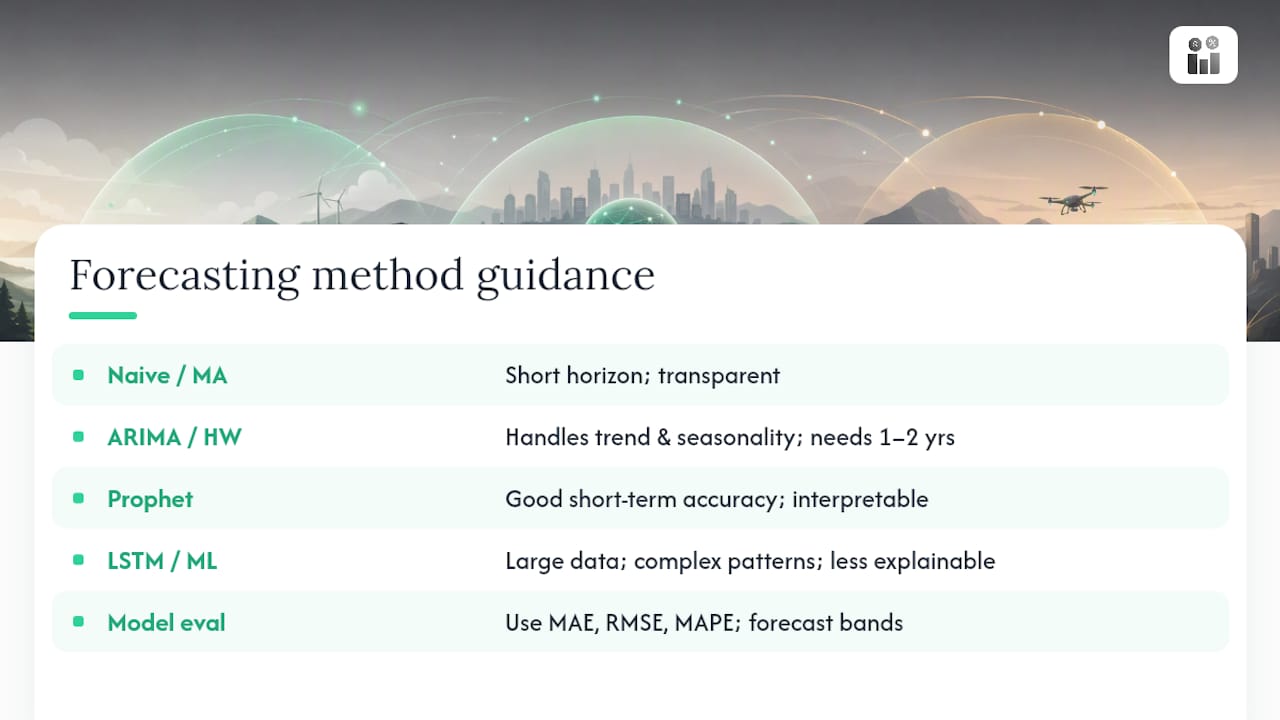
Naive and moving averages work fine for stable, low-variance service lines with short horizons. They’re transparent and require almost no setup, but they miss seasonality and trend shifts entirely.
ARIMA and Holt-Winters models handle trend and seasonality reasonably well once you have at least a year or two of clean historical data. They’re more mathematically involved but still explainable to a non-technical stakeholder.
Prophet, the open-source forecasting library, tends to strike a useful balance for service organizations. A demand forecasting and resource optimization study for a market research firm found Prophet delivered strong short-term accuracy while staying interpretable enough for planners to trust and explain, compared against Holt-Winters, ARIMA, and LSTM alternatives.
LSTM and other machine learning models shine when you have large datasets and complex, overlapping seasonal patterns, but they demand more data engineering and are harder to explain to an operations director who wants to know why the number moved.
Evaluate whichever model you pick against mean absolute error (MAE), root mean squared error (RMSE), and mean absolute percentage error (MAPE), and always build a forecast band rather than a single point estimate. Then layer in business knowledge the model can’t see: a new contract signing, an upcoming campaign, a known competitor exit. The model gives you a starting point, not a verdict.
What Metrics Actually Drive Capacity Decisions?
Raw utilization tells you how busy people are. It doesn’t tell you whether you’re about to miss an SLA or whether you’re carrying capacity you don’t need. You need a small cluster of metrics working together.
Track utilization, first-time-fix rate, average job time, backlog age, response time, and SLA hit rate as your core set. Healthy technician utilization commonly sits around three-quarters to four-fifths of available time, a range that balances productivity against burnout risk. Push utilization much higher and you lose the slack needed to absorb surges or emergencies.
Service level objectives (SLOs) and their underlying service level indicators (SLIs) translate a business promise, like “respond within four hours,” into a measurable target. The gap between your SLO and your actual performance defines an error budget, and that budget is what tells you how much headroom to keep in reserve versus how aggressively you can optimize for cost.
| Metric | What it measures | Why it matters for capacity |
|---|---|---|
| Utilization rate | Percent of paid hours spent on billable work | Too high signals burnout risk; too low signals overstaffing |
| First-time-fix rate | Jobs resolved without a return visit | Low rates quietly consume capacity through rework |
| Backlog age | How long open jobs sit unresolved | Rising age is an early warning of undercapacity |
| SLA hit rate | Percent of jobs meeting the contracted response/completion time | Direct measure of whether current capacity meets commitments |
Constraints shape what you can actually do with these numbers: technician certifications, equipment availability, supplier lead times, and vendor quotas all cap how fast you can close a capacity gap, no matter how clear the metric looks on a dashboard.
How Do You Calculate Field Service Capacity?
The core formula, drawn from how Oracle’s field service capacity documentation frames it, is straightforward:
Usable capacity = (qualified technicians × productive hours) − travel time − admin time − maintenance time
Here’s a worked example. Say you have 12 qualified HVAC technicians, each contracted for 8 hours a day, 5 days a week. That’s 480 gross hours weekly. Now subtract the non-productive load: travel and administrative overhead are typically the single largest drain on usable capacity, often eating 20 to 30 percent of the day. If travel and admin consume 90 hours weekly and vehicle/equipment maintenance windows take another 15, you’re left with 375 usable hours.
Now apply a buffer for vacations, sick days, and training, commonly 10 to 15 percent, which brings realistic usable capacity closer to 320 to 340 hours. If forecasted demand calls for 380 hours of skilled HVAC work that week, you have a real gap of roughly 40 to 60 hours, not a paper shortfall.
Converting that gap into action follows a simple hierarchy:
- Reshape schedules first. Shift lower-priority jobs to reduce peak-week pressure before spending money.
- Cross-train adjacent technicians if the gap is skill-specific rather than volume-specific.
- Bring in subcontractors for short-term spikes rather than hiring for a temporary surge.
- Hire permanently only when the gap repeats across multiple forecast cycles, not just one busy month.
Better technician scheduling can often close 5 to 10 percent of that gap on its own by cutting wasted travel time, before you touch headcount at all.
What Tools Support Accurate Capacity Planning?
The right toolset maps directly to the planning loop rather than replacing it. Telemetry and data capture come first: job duration, travel time, equipment status, and backlog age all need to land in one place, not scattered across spreadsheets and paper tickets.
Forecasting pipelines should retrain on a regular cadence, monthly at minimum for volatile service lines, so the model doesn’t drift as demand patterns shift. Scheduling and dispatch systems need quota matrix logic, time-slot quotas paired with skill buckets, so a plumber’s slot doesn’t get filled by an electrician’s job by mistake. Scenario modeling and dashboards close the loop, letting planners test “what if demand jumps 15 percent next month” before it actually happens, and giving finance and operations leadership a shared view instead of competing spreadsheets. Reviewing technician utilization trends inside that dashboard turns a lagging metric into an early warning system.
How Do You Roll Out a Capacity Planning Program?
Start small, prove the loop works, then widen it. A realistic rollout looks like this:
- Days 1 to 30: Clean up utilization and backlog data, pick one service line or territory as a pilot, and build your first forecast with a basic model.
- Days 31 to 60: Run the calculation formula against real numbers, identify the gap, and test one intervention, a schedule change or a short-term subcontractor.
- Days 61 to 90: Measure results against SLA hit rate and utilization, then decide whether to scale the approach to additional territories or service lines.
After the pilot, tactical reviews should run quarterly and strategic resets annually, with clear decision gates between operations, finance, and HR at each stage. Quick wins, cross-training, temporary contractors, and schedule reshaping, buy time while longer structural changes work through approval.
Pro Tip: Run your 90-day pilot on your worst-performing territory, not your best one. A capacity plan that fixes a struggling region proves the model far faster than one that polishes an already-healthy one.
Where Most Capacity Plans Actually Break Down
Most capacity planning failures aren’t forecasting failures. They’re cultural ones. Teams build a solid annual plan, then treat it as finished, ignoring the skills and geography constraints that make a headcount number meaningless without matching certifications in the right region. Weak monitoring compounds it: a plan reviewed once a year can’t catch a backlog creeping upward in week six.
The fix isn’t a better spreadsheet. It’s treating capacity planning as continuous, with weekly and monthly checkpoints, and using an integrated platform that shortens the distance between spotting a gap and acting on it.
— KaiosMedia
Turn Your Capacity Plan Into a Running Operation
A capacity plan only pays off once it’s running inside your actual scheduling and dispatch system, not sitting in a spreadsheet nobody reopens after the quarterly review. A platform that connects that loop directly: work orders, technician scheduling, real-time job status, and quota views live in one platform instead of three disconnected tools.
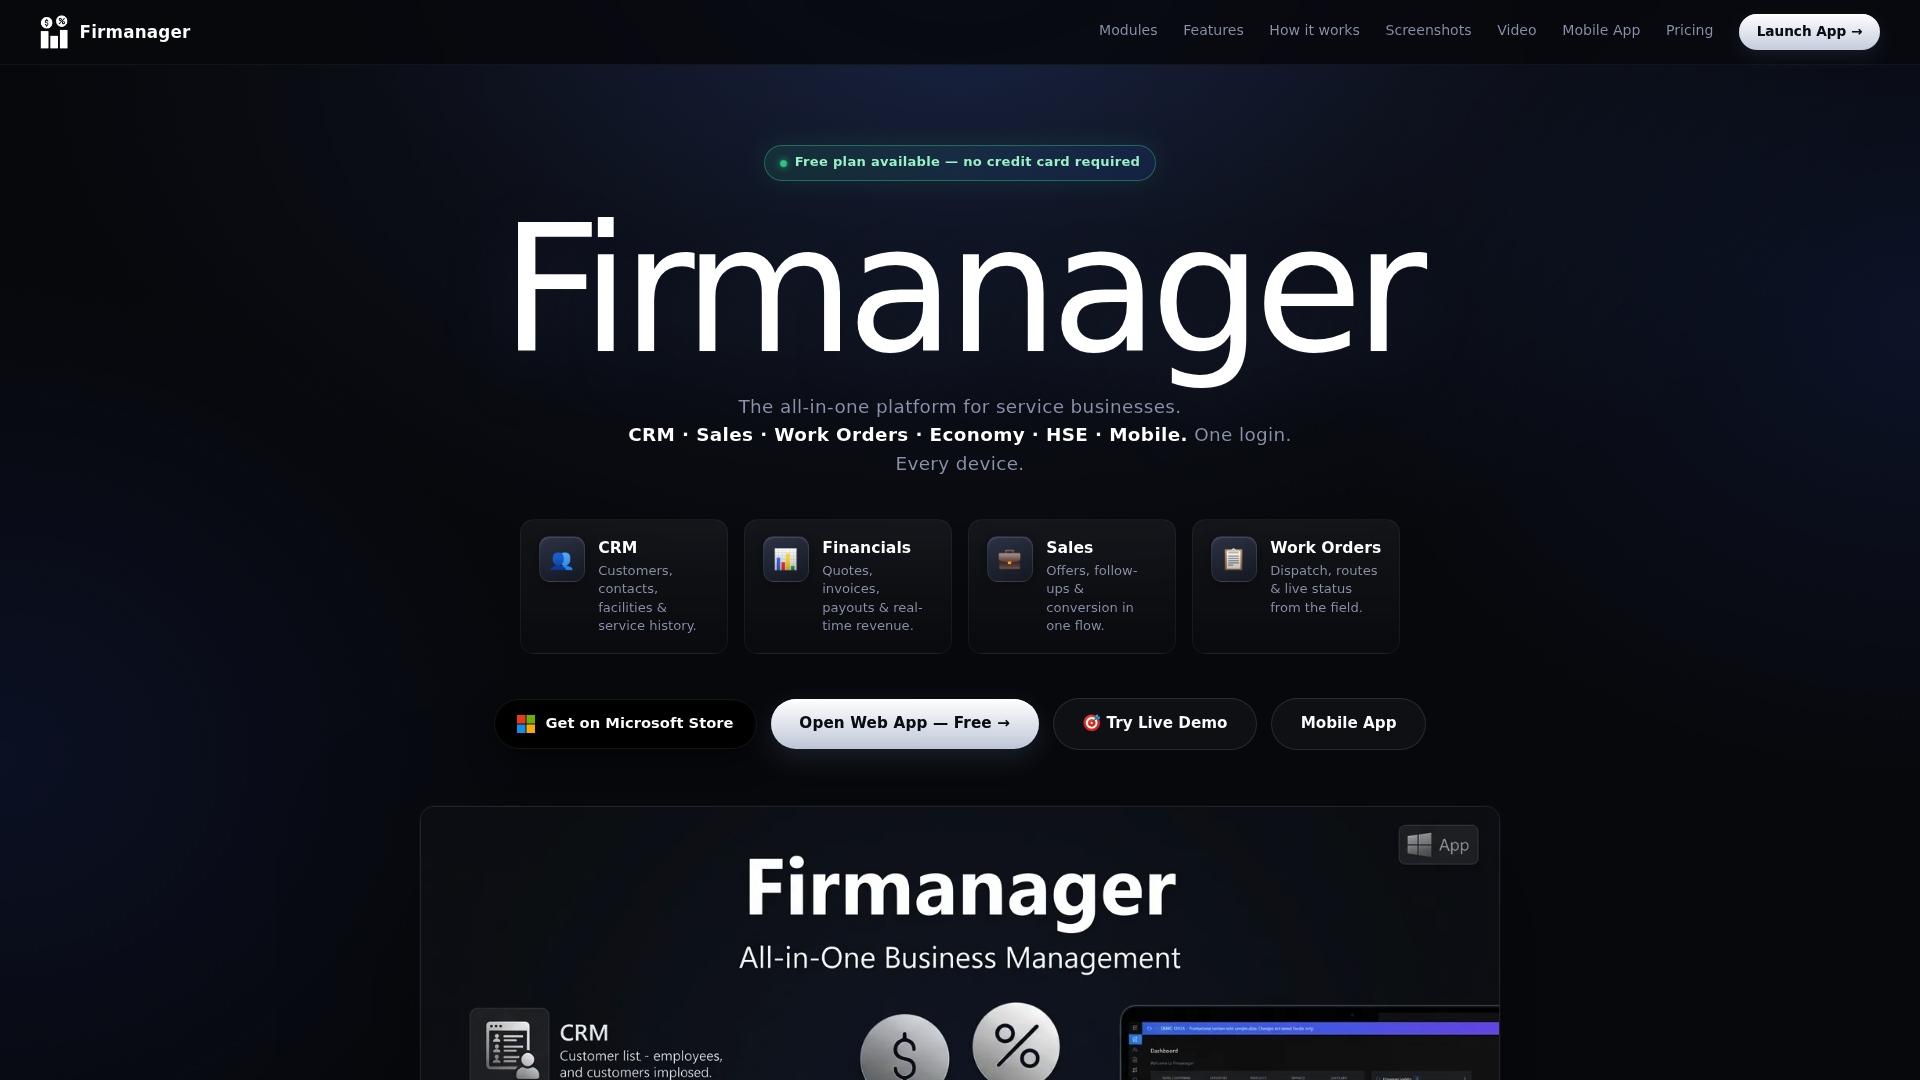
When a forecast says you need more skilled hours next Tuesday, a scheduling and dispatch module can let you see availability, skill match, and territory in one screen instead of cross-referencing spreadsheets. Automated invoicing and financial reporting can then show you whether the capacity you added actually paid for itself. That’s the gap between planning capacity and managing it in real time. Visit the Firmanager platform to start a trial and see how your next capacity gap gets closed before it becomes a missed SLA.
Sources
- Capacity planning - Microsoft Learn (Azure well-architected)
- Oracle Fusion Field Service Capacity Service: Using capacity service
- Predict, Optimize, Deliver: Demand Forecasting and Resource Optimization for a Market Research Firm
- Capacity Planning: Best Practices in Field Service
FAQ
What Are the Three Types of Capacity Planning?
Strategic (12 to 24 months), tactical (3 to 12 months), and operational (days to weeks) planning cover long-term investment, seasonal staffing, and daily scheduling decisions respectively.
Can You Give an Example of a Capacity Plan?
A basic example: 12 technicians at 480 gross weekly hours, minus travel, admin, and maintenance time, yields roughly 320 to 340 usable hours; comparing that against forecasted demand of 380 hours reveals a gap addressed through schedule changes, cross-training, or subcontracting.
What Is the Best Tool for Capacity Planning?
There’s no single best tool, but effective platforms combine telemetry capture, a retrainable forecasting engine, and scheduling with quota logic; an all-in-one platform like Firmanager consolidates work orders, scheduling, and reporting so the planning loop runs in one system.
How Do You Perform Capacity Planning?
Assess current capacity, forecast demand using historical and business data, calculate required hours against available capacity, identify and prioritize gaps, then monitor results on a weekly or monthly cadence to keep the plan current.
Recommended
Run your whole business in one place
CRM, quotes, work orders, invoicing, expenses, HR and HSE — one login, every device. Free-forever plan.
Start free →