First Time Fix Rate: How Field Managers Improve It
First Time Fix Rate: How Field Managers Improve It
First-time fix rate (FTFR) is the percentage of service jobs a technician completes on the first visit, with no follow-up call, missing part, or specialist required. The average FTFR sits around 80%, while best-in-class operations report FTFR between 89% and 98%. Two moves start paying off within a month: agree on one written definition of “resolved” across dispatch and field teams, and run a 30-day parts-stock audit on your highest-volume job types to catch the shortages quietly killing your numbers.
That second step matters more than most managers assume. A truck-roll cost analysis from PTC shows laggard organizations resolve issues on the first visit only about 63% of the time, compared to 88% for top performers. Every point of gap between those numbers is a second dispatch, a second set of drive time, and a customer who now questions whether you know what you’re doing.
Key Takeaways
Raising first time fix rate depends on diagnosing the dominant root cause first, then applying the specific tactic that fixes it, measured against one consistent definition.
| Point | Details |
|---|---|
| Fix your definition first | Agree on one written definition of “resolved” across dispatch, field, and reporting before chasing a target. |
| Diagnose before you fix | Tag 90 days of failed first visits by root cause to find which lever, parts, skills, or data, deserves budget first. |
| Set segmented targets | Use different FTFR benchmarks for simple, mid-complexity, and specialty jobs rather than one company-wide number. |
| Pair FTFR with companion metrics | Track repeat-visit rate and CSAT alongside FTFR to catch metric gaming early. |
| Start a 90-day pilot | Test one tactic on your two highest-volume job categories, measure weekly, and target a 3 to 5 percentage point quarterly gain. |
Table of Contents
- What Counts as a First Time Fix (and What Doesn’t)
- Why First Time Fix Rate Drives Cost, Capacity, and Customer Trust
- What’s a Good First Time Fix Rate for Your Industry?
- How to Calculate FTFR: A Worked Example
- The Most Common Reasons FTFR Falls Short
- Tactics That Actually Move the Needle on FTFR
- Reporting FTFR Without Fooling Yourself
- Where Field Service Software Fits Into FTFR Improvement
- Why Most FTFR Advice Misses the Point
- Frequently Asked Questions
- Sources
What Counts as a First Time Fix (and What Doesn’t)
FTFR only counts a job as fixed if the technician resolves it during that single visit, with nothing left dangling. No callback for a missing part. No second appointment because the wrong specialist showed up. No escalation to someone with different credentials. If any of those happen, the job counts against you, even if the eventual outcome was fine.
The formula is simple:
FTFR = (Jobs Completed on First Visit ÷ Total Jobs Completed) × 100
The hard part isn’t the math. It’s agreeing, across dispatch, field, and reporting, on what “completed” and “first visit” actually mean. Here’s where most operations get inconsistent:
- Include: jobs closed on visit one with no return trip needed for the same issue.
- Include: jobs where the technician diagnosed correctly and repaired fully, even if a warranty part was swapped.
- Exclude: follow-ups caused by a missing or wrong part the technician should have had on the truck.
- Exclude: repeat visits triggered by inaccurate job data, wrong address, or incomplete site access notes.
- Gray area to decide upfront: customer-requested follow-ups (a homeowner who wants a second opinion) shouldn’t count against FTFR if the original repair was sound. Document that rule in writing so nobody argues about it during monthly reporting.
FTFR is often confused with first contact resolution (FCR), but they measure different moments. FCR tracks whether a customer’s issue gets resolved during the first remote interaction, usually a phone call or chat before anyone gets dispatched. FTFR only kicks in once a technician is physically on site. A comparison of the two metrics makes the case that tracking both gives you the full arc of service quality, from intake through field execution. Resolution rate is broader still, often lumping in issues closed over multiple channels across any timeframe, which makes it too loose to drive technician-level accountability on its own.
Why First Time Fix Rate Drives Cost, Capacity, and Customer Trust
Every percentage point of FTFR you lose becomes a second dispatch you have to pay for. That’s fuel, drive time, technician hours, and a scheduling slot that could have gone to a new customer instead. PTC’s benchmark data puts the gap between average (80%) and laggard (63%) performance at 17 percentage points, which on a busy field team translates into dozens of extra truck rolls a month, each one adding material cost on top of labor.
Best-in-class field service organizations resolve issues on the first visit about 88% of the time. Average organizations reach roughly 80%, and laggards fall to around 63%, a gap that drives significant extra dispatches and material costs across an operation’s entire service portfolio.
The capacity math is where this gets interesting for growth-minded managers. A technician who fixes it right the first time doesn’t just save you a truck roll. They free up a slot on tomorrow’s schedule that would otherwise be consumed by a callback. The same logic that drives capacity gains in call centers when first contact resolution improves applies directly to field teams: every job closed on the first pass returns staffed hours to the pool instead of recycling them into rework. Higher FTFR effectively expands your team’s capacity without hiring anyone.
One caution worth flagging before you set aggressive targets: FTFR can be gamed. Technicians under pressure to hit a number may mark jobs “resolved” prematurely, defer necessary follow-ups into a separate work order that doesn’t count against the metric, or avoid taking on complex jobs altogether. Pair FTFR with customer satisfaction scores and repeat-visit tracking within 30 days, so a rising fix rate reflects real quality, not selective reporting.

What’s a Good First Time Fix Rate for Your Industry?
“Good” depends heavily on job complexity, so a single target number across every service type is a mistake. IBM’s benchmark data puts average FTFR around 80%, with top performers reaching 89% to 98%. Where you land inside that range should shift based on what your technicians are actually walking into.
Segment your targets by job type, asset class, and even technician skill level rather than chasing one company-wide number. A technician new to a product line will naturally post lower FTFR than a ten-year veteran on the same equipment, and holding both to an identical benchmark just breeds frustration or, worse, incentivizes shortcuts.
For pacing improvement, aim for incremental gains of 3 to 5 percentage points per quarter rather than a dramatic jump. FTFR moves through operational habits, parts logistics, and training cycles, not through a single policy memo. A team that jumps from 70% to 95% in one quarter almost certainly changed its reporting definition, not its actual performance.
How to Calculate FTFR: A Worked Example
Start with one definition of “resolved” and stick to it across every technician, region, and reporting period. Here’s the formula again, applied to real numbers.
Say your team completed 420 service calls in March. Of those, 336 were resolved on the technician’s first visit, no callback, no missing parts, no escalation. The other 84 needed at least one additional trip.
FTFR = (336 ÷ 420) × 100 = 80%
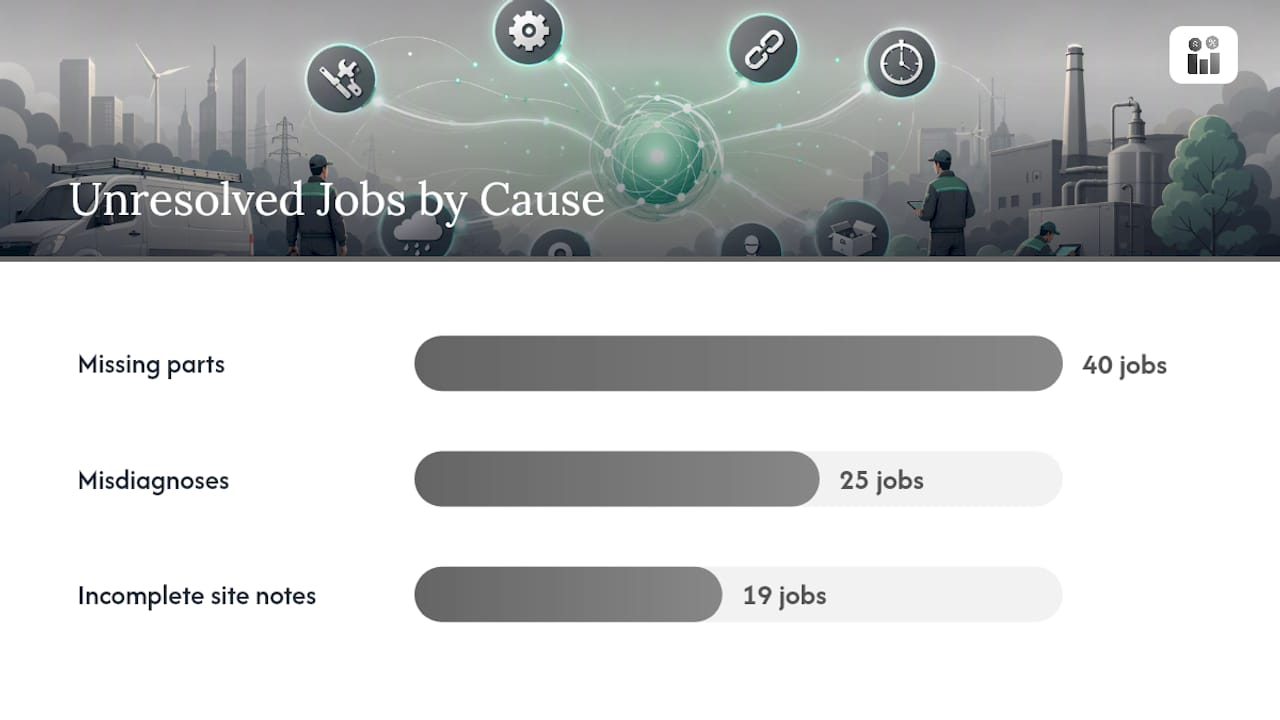
That 80% lines up with industry average benchmarks, which tells you where you stand but not where the leaks are. Break that same 84 unresolved jobs down by cause, and you might find 40 were missing-parts callbacks, 25 were misdiagnoses requiring a specialist, and 19 were driven by incomplete site notes. Each cause needs a different fix, which is why the raw percentage is a starting point, not a diagnosis.
Choose your measurement window deliberately. Monthly windows catch problems fast enough to act on them, but small technician teams can see noisy swings from a handful of tough jobs. Quarterly windows smooth that noise but delay your reaction time. Many operations run both: a rolling 30-day window for operational course correction, and a quarterly view for setting targets and comparing technicians fairly.
Decide your exclusions before you start counting, not after a bad month makes you want to. Warranty callbacks tied to a part failure unrelated to the original repair typically shouldn’t count against the technician who did the first job correctly. Customer-initiated follow-ups for reasons unrelated to repair quality, like a homeowner changing their mind about a recommended upgrade, also belong outside the calculation. Write these rules down once and apply them consistently, or your FTFR trend line becomes meaningless.
The Most Common Reasons FTFR Falls Short
Most low FTFR problems trace back to a handful of repeat offenders, and diagnosing which one dominates your operation is the fastest way to know where to spend your improvement budget.
- Parts shortages: technicians arrive without the component they need, often because forecasting doesn’t account for seasonal demand or fast-moving SKUs.
- Skill mismatches: a technician gets dispatched to a job outside their certification or experience level, usually because dispatch software matches on availability rather than skill.
- Poor job data: incomplete site notes, wrong equipment model numbers, or missing access instructions send technicians in blind.
- Routing and coverage gaps: the nearest available technician isn’t the right technician, and geography wins over expertise in the dispatch decision.
- Unclear closeout rules: technicians close jobs inconsistently, some marking partial fixes as “resolved” and others flagging the same situation as a needed follow-up.
To figure out which cause dominates your operation, pull your last 90 days of failed first-visit jobs and tag each one by root cause. Field Nation’s analysis of repeat-visit drivers notes that missing parts, skill mismatches, and poor job data are the most common culprits across field service operations, and the mix usually skews heavily toward one or two of them rather than spreading evenly. A quick diagnostic checklist: check parts-on-hand rates for callback jobs first, then cross-reference technician certification against job type, then audit a sample of closeout notes for completeness. Whichever category surfaces the most red flags is where you start.
Tactics That Actually Move the Needle on FTFR
Fixing FTFR works best when each tactic targets a specific cause you’ve already diagnosed, rather than throwing every improvement idea at the wall at once.
- Pre-stage parts for high-volume job types. If your diagnostic showed parts shortages as the dominant cause, forecast demand by job category and pre-stage or pre-ship common components to technician vehicles or nearby depots. Pilot this on your top three most-dispatched job types for 60 days and measure the callback rate before and after.
- Switch to skills-based dispatch. When skill mismatch is the culprit, automated dispatch that matches technician certifications and historical completion rates to job requirements catches problems before the truck leaves the yard. Pairing dispatch automation with technician performance history is one of the more reliable levers available to operations teams.
- Standardize closeout templates. Inconsistent closeout data makes FTFR noisy and hard to act on. Require technicians to log parts used, diagnostic results, and a clear resolved/unresolved flag on every job, with no free-text workarounds.
- Build mobile-enabled diagnostic checklists. Give technicians a structured flow for common failure modes on their device, reducing guesswork on complex equipment and shortening the time to accurate diagnosis.
- Tighten job intake data. Require dispatch to confirm equipment model, access instructions, and prior service history before scheduling, cutting down on the “poor job data” category of failures.
- Add remote expert assistance for edge cases. For the toughest 10% to 15% of jobs, give field technicians a way to video-call a senior specialist mid-job rather than rescheduling a second visit entirely.
Each of these ties back to three foundational levers: technician skill, diagnostic tooling, and parts logistics. Improvements in any one compound with the others, so a team investing in mobile diagnostics alongside skills-based dispatch typically sees faster gains than either tactic alone.
Pro Tip: Pilot one tactic on one job category before rolling it out company-wide. A 60-day test on your three highest-volume job types gives you a clean before-and-after comparison without disrupting your whole operation, and it tells you which lever is worth scaling first.

Sequence matters here. Fix your closeout data quality first, since every other tactic depends on trustworthy numbers to measure against. Then tackle whichever root cause your diagnostic flagged as dominant. Rolling out five tactics simultaneously makes it nearly impossible to tell which one actually worked.
Reporting FTFR Without Fooling Yourself
A number that looks great on a dashboard but doesn’t reflect reality is worse than no metric at all, because it tells leadership everything’s fine while repeat visits keep costing money underneath.
The core reporting rules are straightforward: use one definition of “resolved” across every team and subcontractor, exclude non-actionable callbacks you’ve defined in advance, and keep your measurement window consistent so month-over-month comparisons actually mean something. The moment one region starts counting differently than another, your company-wide FTFR number becomes fiction.
Watch for these specific pitfalls, since they show up in nearly every operation at some point:
| Pitfall | What it looks like | How to avoid it |
|---|---|---|
| Inconsistent closeout data | Technicians use different language for the same outcome, making follow-ups hard to tag correctly | Standardize closeout forms with fixed fields, not free text |
| Subcontractor reporting gaps | Third-party crews report FTFR differently than in-house staff | Apply the same definition and template contractually to subcontractors |
| Metric gaming | Technicians mark jobs resolved prematurely to hit a target | Cross-check FTFR against 30-day repeat-visit and CSAT data |
| Mixing measurement windows | Comparing a rolling 30-day figure to a fixed quarterly figure | Pick one window type per reporting cadence and stick to it |
FTFR works best paired with companion metrics rather than tracked in isolation. Truck-roll cost tells you the financial stakes behind every percentage point. Mean time to repair shows whether jobs are getting faster or just getting marked “done” faster. Repeat visit rate within 30 days catches gaming that a raw FTFR number would hide. Customer satisfaction scores confirm whether a rising fix rate is translating into happier customers or just cleaner paperwork. Tracking KPI performance consistently, the same discipline accounting and analytics partners bring to financial reporting, applies just as well to operational metrics like FTFR.
Where Field Service Software Fits Into FTFR Improvement
Software doesn’t fix technicians’ skills or stock your parts room by itself, but the right platform removes the friction that turns preventable problems into repeat visits.
Dispatch automation matches technician skill sets to job requirements before the truck leaves, addressing the skill-mismatch cause directly. Parts and inventory management modules track stock levels by location and job type, supporting the pre-staging tactic that fixes shortage-driven callbacks. Mobile job packs put site history, equipment manuals, and prior service notes directly on a technician’s device, closing the poor-job-data gap that sends people in blind. A searchable knowledge base gives technicians access to diagnostic guides on unfamiliar equipment without waiting for a callback from dispatch. IoT alerts on connected equipment can flag failure patterns before a customer even calls, letting you dispatch with the right parts already loaded. Performance analytics dashboards let you segment FTFR by technician, job type, and asset class, exactly the kind of breakdown that turns a flat 80% into an actionable diagnostic.
Here’s the practical shortlist worth checking against your current stack:
- Skills-based dispatch tied to technician certification records, not just availability.
- Real-time parts inventory visibility across trucks, depots, and warehouses.
- Mobile access to equipment history, site notes, and closeout templates from the field.
- A standardized digital closeout form that eliminates free-text ambiguity.
- Analytics that break FTFR down by technician, job category, and asset class monthly.
If you’re evaluating your current setup, Firmanager brings dispatch, work orders, inventory tracking, and real-time analytics into one login, which matters because FTFR improvement usually stalls when data lives in three disconnected systems, and nobody can see the whole picture at once. Start a 90-day pilot on your two highest-volume job categories: track FTFR weekly, tag every failed first visit by root cause, and compare your baseline against the 3 to 5 percentage point quarterly target discussed earlier. Success criteria should include both the FTFR number and a stable or improved customer satisfaction score, so you know the gain is real and not just a reporting artifact. Managers evaluating platform options more broadly can also compare field service software alternatives or dig into work order software built for maintenance teams to see how closeout and scheduling features stack up against what’s outlined here.
Why Most FTFR Advice Misses the Point
Most articles on this topic treat first time fix rate like a single lever: train your technicians better, stock more parts, buy better software, and the number goes up. That framing is comfortable but wrong, because it assumes every operation’s 20-point gap between average and best-in-class performance has the same cause. It doesn’t.
The uncomfortable truth is that FTFR is a symptom metric, not a root-cause metric. A number sitting at 72% could mean your parts forecasting is broken, or it could mean half your team is dispatched to jobs above their skill level, or it could mean your closeout data is so inconsistent that you’re not even measuring the same thing month to month. Treating all three situations with the same generic advice, “improve training and stock more inventory”, wastes budget on the wrong fix two times out of three.
What the evidence actually supports is diagnosis before tactics. The operations that move their FTFR fastest aren’t the ones that adopt the most tools. They’re the ones that spend two weeks tagging their last quarter of failed first visits by cause, then attack whichever category dominates. That’s less exciting than a software rollout announcement, but it’s the difference between a 3-point quarterly gain and a number that plateaus after the initial improvement wears off.
The other overlooked piece is measurement discipline. Everyone wants to talk about tactics. Almost nobody wants to talk about the boring work of standardizing closeout forms and agreeing on exclusion rules before chasing a target. Skip that step, and you’ll spend six months debating whether your FTFR actually improved or whether someone just started reporting differently. Get the definition right first. Everything else compounds from there.
Frequently Asked Questions
What is a good first time fix rate? Around 80% is average across field service operations, while best-in-class teams reach 89% to 98%. What counts as “good” for your team depends on job complexity, so segment targets by job type rather than chasing one universal number.
How is first time fix rate calculated? FTFR equals the number of jobs resolved on the technician’s first visit divided by total jobs completed, multiplied by 100. If 336 out of 420 jobs were fixed on the first try, that’s an 80% FTFR.
What’s the difference between FTFR and first call resolution? FTFR measures on-site technician success during a physical visit. First contact resolution measures whether an issue gets solved during the initial remote interaction, before anyone gets dispatched. Tracking both together gives you the full picture from intake to field execution.
What causes low first time fix rates? The most common drivers are missing parts, technician skill mismatches, incomplete job data, and inconsistent closeout practices. Diagnosing which cause dominates your operation before choosing a tactic saves time and budget.
How often should FTFR be measured? Run a rolling 30-day window for operational course correction and a quarterly view for setting targets and comparing technicians. Consistency in your measurement window matters more than the specific cadence you choose.
Can improving FTFR actually increase revenue? Yes, indirectly. Every job resolved on the first visit frees up a technician slot that would otherwise go to a callback, expanding your team’s effective capacity without adding headcount, the same principle that drives capacity gains when first-contact resolution improves in call centers.
Sources
These sources go deeper into benchmarking, measurement methodology, and the FCR/FTFR relationship if you want to build out your own reporting framework.
- What is First-Time Fix Rate (FTFR)? | IBM
- What is First-Time Fix Rate? | PTC
- What Is First-Time Fix Rate & How to Improve Your FTFR
Recommended
Run your whole business in one place
CRM, quotes, work orders, invoicing, expenses, HR and HSE — one login, every device. Free-forever plan.
Start free →