Technician Utilization: How to Measure and Improve It

Technician Utilization: How to Measure and Improve It
Technician utilization is the share of a technician’s paid hours spent on productive or billable work, and it’s the single most revealing efficiency number a service manager can track. The formula: Utilization = Productive (or billable) hours ÷ Total available hours × 100.
Industry benchmarks generally land in a wide band. According to Attainmentlabs, average performers sit around 55%–60%, good teams reach 65%–70%, and top performers hit 75%–80%. Pushing past 85% often signals overbooking, not excellence.
- Utilization tells you how hours get used, not whether the business is profitable
- A 10-point improvement in utilization can meaningfully lift revenue per technician
- Chasing the highest possible number backfires when it kills your slack for urgent jobs
Key Takeaways
Technician utilization improves fastest when managers pair a clear formula with consistent measurement, targeted operational fixes, and software that closes the gap between dispatch and documentation.
| Point | Details |
|---|---|
| Use one formula, consistently | Utilization = productive hours ÷ available hours × 100, applied the same way every period. |
| Target a band, not a ceiling | Aim for 65%–75% in most field service contexts; above 85% often signals overbooking. |
| Track supporting KPIs together | Pair utilization with first-time-fix rate, overtime, and customer satisfaction to avoid a misleading picture. |
| Fix admin and routing first | Digitizing forms and tightening dispatch routes deliver the fastest, cheapest gains. |
| Follow AAHA guidance in veterinary settings | Delegate clinical tasks to technicians with clear protocols and documentation to protect patient safety. |
| Pilot before scaling | Run a 30 to 60 day test with baseline and target metrics before rolling changes out company wide. |
| Use an integrated platform to sustain gains | Firmanager combines dispatch, mobile work orders, time tracking, and analytics in one system to track utilization changes in real time. |
Table of Contents
- What Is Technician Utilization, and How Do You Calculate It?
- Utilization Benchmarks by Industry and Team Size
- What to Measure: The KPIs That Feed Utilization
- Why Utilization Drops, and Quick Fixes You Can Apply This Week
- Operational Levers That Sustainably Raise Utilization
- What Software Features Actually Move the Utilization Needle
- A 90-Day Plan to Raise Technician Utilization
- Applying AAHA’s Technician Utilization Guidelines in Practice
- Build Your Own Utilization Pilot in Three Steps
- Putting the Plan Into Action With Firmanager
- Frequently Asked Questions
- Sources
What Is Technician Utilization, and How Do You Calculate It?
Three terms get tangled constantly: billable hours (work you invoice directly), productive hours (any hands-on task, billable or not), and utilization rate (the ratio between one of those and total available time). Mixing them up is why two managers can look at the same team and report wildly different numbers.
- Standard formula: Productive hours ÷ available hours × 100
- Billable variant: Billable hours ÷ available hours × 100 (stricter, revenue-focused)
- Daily/monthly variant: Same math, applied to a shift or a pay period instead of a year
Say a technician clocks 40 hours in a week, spends 6 on travel, 4 on admin, and logs 28 hours of hands-on service work. That’s a solid number by most standards, but it hides the fact that a third of paid time never touches a customer.
- Decide upfront whether travel counts as productive
- Apply the same rule across your whole team, every reporting period
- Recalculate whenever job types or routes change significantly
Pro Tip: VSight recommends writing your utilization definition down as a one-page policy. Without it, every manager on your team will quietly calculate it differently.
Utilization Benchmarks by Industry and Team Size
Target bands beat single numbers, because a “good” utilization rate depends heavily on context. A field service company should not measure itself against a professional consulting firm, and neither should measure itself against a veterinary clinic.
- Field service (HVAC, electrical, plumbing): 65%–75% is typically strong, per attainmentlabs.com
- Professional services: often runs lower, since strategy and client meetings count as non-billable
- Veterinary practices: benchmarks skew differently because technicians split time between clinical support, client education, and administrative documentation
- Small teams (under 10 techs): more schedule volatility, so expect wider swings week to week
For veterinary practice managers specifically, the 2023 AAHA Technician Utilization Guidelines are the reference point every serious operator should know. AAHA frames technician utilization not just as an efficiency metric but as an access-to-care issue: underused technicians mean fewer patients seen and more burnout for veterinarians carrying tasks that could be delegated.
What to Measure: The KPIs That Feed Utilization
Utilization is a downstream number. It only means something when you’re also tracking the inputs that build it and the outcomes it affects.
The core inputs: billable or productive hours, total clocked hours or shift capacity, travel time, administrative time, and idle or waiting time. Miss any one of these and your utilization figure will be wrong in a direction that flatters your team.
- First-time-fix rate — low utilization sometimes means jobs are getting redone
- Response time — slow dispatch inflates idle hours
- Overtime hours — high utilization paired with high overtime is a burnout warning, not a win
- Customer satisfaction — QwikTime warns that utilization tracked alone can hide low-margin work and quietly declining service quality
| Dashboard element | Reporting frequency |
|---|---|
| Utilization rate by technician | Weekly |
| Travel and admin time split | Weekly |
| First-time-fix rate | Monthly |
| Overtime and idle hours | Daily |
| Customer satisfaction score | Monthly |
Why Utilization Drops, and Quick Fixes You Can Apply This Week
Utilization rarely falls because technicians are slacking. It falls because of structural friction: bad routing that stacks travel time, scheduling gaps between jobs, skills mismatches that send the wrong technician to the wrong job, and admin work that eats hours nobody accounted for.
- Clarify scope of practice so technicians aren’t waiting on approvals for routine tasks
- Cut repetitive admin by digitizing forms and job notes at the point of service
- Rebalance skills across the team instead of routing every complex job to your top performer
- Tighten routing and dispatch sequencing to shrink windshield time
Pro Tip: PTC’s field service research points to removing administrative “busy work” as the single highest-leverage, lowest-cost fix most teams overlook.
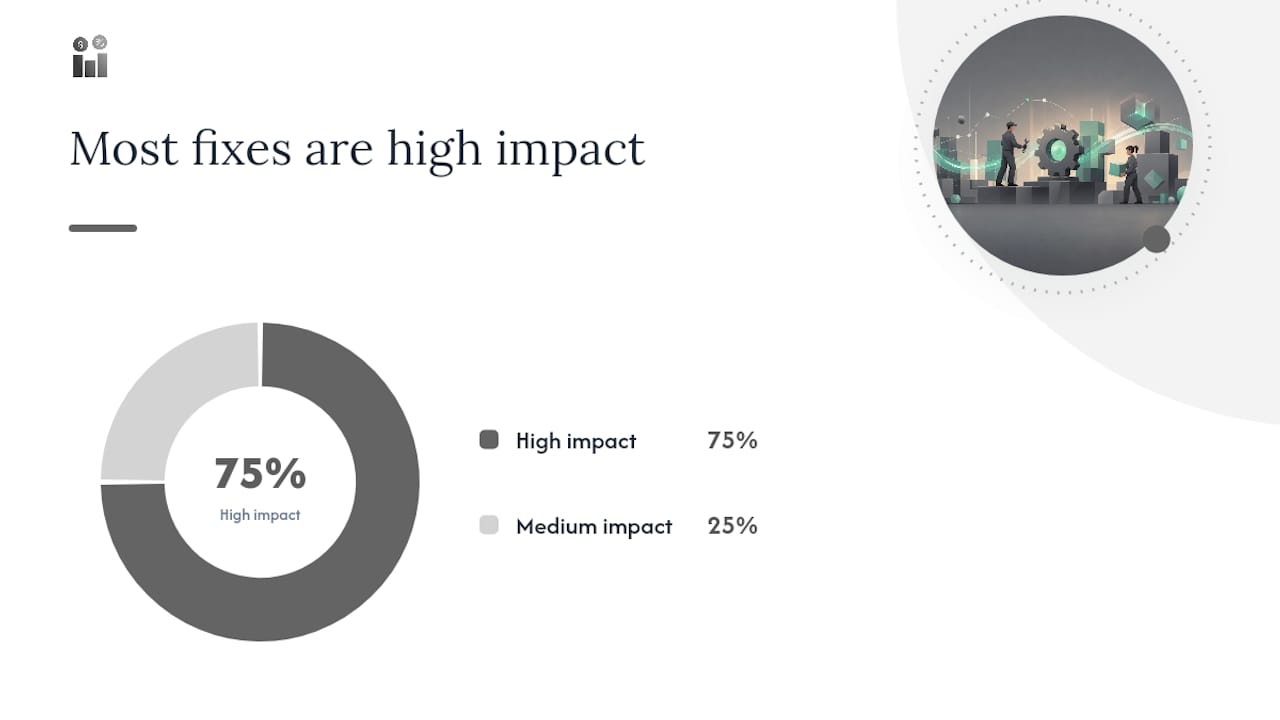
| Fix | Effort | Impact |
|---|---|---|
| Digitize admin forms | Low | High |
| Rebalance skills across team | Medium | High |
| Overhaul dispatch routing | Medium | Medium |
| Full scheduling software rollout | High | High |
Start with the low-effort, high-impact items. They buy you credibility before you tackle the bigger structural changes.
Operational Levers That Sustainably Raise Utilization
Quick fixes recover lost hours. Sustained gains come from redesigning how work gets assigned in the first place.
- Skills-based dispatch — match job complexity to the right technician instead of defaulting to seniority
- Shift redesign — stagger start times to match real demand curves instead of a flat 8-to-5 schedule
- Scope-of-practice adjustments — delegate tasks that don’t require your most credentialed staff member
- Remote support — PTC notes that remote diagnostic assistance cuts unnecessary truck rolls and repeat visits
- Audit daily task lists once a quarter to catch scope creep
- Flag any task a lower-tier role could legally and safely handle
- Reassign recurring admin tasks to a dispatcher or coordinator, not the technician in the field
Pro Tip: Run the role-scope audit with the technicians themselves in the room. They usually know exactly where their time leaks before you do.
What Software Features Actually Move the Utilization Needle
Not every feature in a field service management platform affects utilization equally. Focus your evaluation on the ones that touch the hours technicians actually lose.
- Route optimization to cut travel time between jobs
- Skills-based dispatch to reduce mismatched assignments and repeat visits
- Mobile work orders so technicians document jobs on-site instead of after hours
- Parts and inventory visibility to avoid return trips for missing materials
- Real-time job history so the next technician on a repeat call isn’t starting blind
- Pilot the tool with one team for 30 to 60 days
- Track utilization, travel time, and admin time before and after
- Compare pilot results against your baseline, not against vendor marketing claims
A standalone dispatch tool can help a small team with one bottleneck. Larger operations juggling CRM, invoicing, and compliance usually outgrow bolted-together point solutions fast, which is where an integrated workforce platform earns its keep.
A 90-Day Plan to Raise Technician Utilization
- Days 1 to 30: Clean up your time-tracking data, define what counts as productive time, and establish your baseline utilization rate. Owner: operations manager.
- Days 31 to 60: Pilot one scheduling or dispatch change with a single team. Owner: dispatch lead.
- Days 61 to 90: Compare pilot results to baseline, then roll out the change company wide if it holds.
- Expect modest software and training costs in the first 30 days, mostly time, not cash
- Estimate ROI by multiplying your utilization gain by average revenue per productive hour
- Anticipate pushback when you change schedules or reassign tasks. Communicate the “why” before the “what.”
Applying AAHA’s Technician Utilization Guidelines in Practice
The 2023 AAHA Technician Utilization Guidelines push veterinary practices to delegate more clinical and client-facing work to credentialed technicians, freeing veterinarians for diagnosis and surgery. An AVMA task force echoes this, recommending workflow and licensing changes that widen what technicians can legally handle.
- Triage workflows: trained technicians perform initial assessments before the veterinarian steps in
- Preventive care visits: technicians run vaccine appointments and wellness checks independently
- Technician-led appointments: nail trims, medication refills, and post-op checks handled without a veterinarian present
Utilization gains in a veterinary setting only count if patient safety documentation keeps pace. Every delegated task needs a clear protocol and a paper trail, not just a verbal handoff.
Some veterinary organizations recommend piloting these changes on a small scale first, tracking both utilization and patient-care outcomes before expanding.
Build Your Own Utilization Pilot in Three Steps
A pilot only works if you set targets before you start, not after you see the results.
- Collect data for two full weeks before changing anything. Tag every hour by category: productive, travel, admin, idle.
- Run the pilot for 30 days with one team, changing only one variable at a time.
- Apply a decision rule: if utilization improves without a drop in first-time-fix rate or satisfaction scores, scale it. If either drops, adjust before expanding.
Utilization is a means, not the mission
Chasing utilization for its own sake produces burned-out technicians and inflated numbers that mask declining service quality. The smarter approach pairs utilization with first-time-fix rate, customer satisfaction, and staff engagement, because a high number that comes at the cost of your best people isn’t a win. Utilization divorced from productivity and profitability tells you almost nothing about whether your business is actually healthier. Set targets in bands, watch the human cost, and adjust when the number climbs but morale doesn’t.

Putting the Plan Into Action With Firmanager
Firmanager is the platform built to run the levers this article just walked through, without stitching together five separate tools to do it. Skills-based dispatch and route sequencing live in the same system as mobile work orders, so technicians document jobs on-site instead of losing an hour to paperwork after their last stop. Real-time analytics turn your utilization, travel time, and admin time into a live dashboard instead of a spreadsheet somebody updates on Fridays. Time tracking feeds directly into the same login your team already uses for CRM and invoicing.
During a pilot, watch three numbers: utilization rate, travel time per job, and admin minutes per shift. If all three move in the right direction inside 30 days, you have your business case for a full rollout. Start a trial through the Firmanager platform and connect your first team’s schedule this week.
Frequently Asked Questions
What is a good technician utilization rate? Veterinary practices and professional services often run lower due to client education and documentation time built into the role.
Is technician utilization the same as productivity? No. Utilization measures how paid hours are split between productive and non-productive work. Productivity measures output per hour worked, regardless of the utilization ratio.
Does travel time count toward utilization? It depends on your policy. VSight recommends deciding explicitly and applying that rule consistently across your entire team.
How often should I measure technician utilization? Review it weekly at the technician level and monthly at the team level, alongside first-time-fix rate and customer satisfaction scores.
Can software alone fix low utilization? No. Software surfaces the data and removes friction like manual paperwork and poor routing, but scheduling design, scope-of-practice decisions, and training still require management judgment.
Sources
- 2023 AAHA Technician Utilization Guidelines
- How to Maximize Technician Productivity & Utilization | PTC
- What Is Technician Utilization Rate? | Field Services
- Technician Utilization Rate: Formula & Benchmarks | VSight
- Utilization vs Productivity vs Profitability: What Leaders Get Wrong - QwikTime – Best Time Tracking Software for Maximizing Team Productivity
Save the AAHA guidelines for your next practice review. They’re the document your team will return to whenever a scope-of-practice question comes up.
Recommended
Run your whole business in one place
CRM, quotes, work orders, invoicing, expenses, HR and HSE — one login, every device. Free-forever plan.
Start free →